Hint: This website is not optimized for your browser version.
Electricity trade in September and October 2018
22 November 2018 – In September and October, Germany again exported more electricity than it imported. However, net exports fell by 20% compared with the same period of the previous year. The largest importers of electricity produced in Germany were Austria, the Netherlands and Switzerland. The wholesale price of electricity averaged €53.96/MWh, which is significantly higher than the average price in the same period of the previous year.

In September and October, Germany's commercial net exports amounted to 8,578 GWh. This is equivalent to 9.6% of the electricity generated in Germany during that period. In comparison with the previous year, net exports fell by just over 20%, partly because total consumption in Germany was 5% higher than the previous year's figure and there was lower overall demand in neighbouring countries as well. Net exports were down although the amount of electricity produced in Germany was almost the same.
Germany's electricity trade with neighbouring countries in detail
The top recipient of Germany's net exports (exports less imports) was Austria, which accounted for 5,485 GWh (up 35% year-on-year). This figure shows that trading between Germany and Austria is still very liquid, even after the introduction of congestion management on the 1st of october 2018. The agreed minimum transmission capacity of 4.9 GWh an hour was maintained and was actually exceeded in 100 hours. During those times, trading was able to take place to the extent permitted by the actual capacity limit of the network. It should be noted that the transmission capacity can vary depending on the current network situation within Germany or Austria. The congestion management kicks in if demand for electricity is greater than the lines can deal with at a particular time. The result is different prices for Germany and Austria.
The Netherlands were in second place in terms of exports, receiving 1,742 GWh (down 10%), ahead of Switzerland with 1,546 GWh net (down 10%). Exports to France were sharply down (71%) to 872 GWh from 3,019 GWh in the same period of the previous year. One reason why exports were higher in 2017 could be that the Tricastin nuclear power plant was temporarily shut down during that period. In September 2017, the French nuclear authority ordered all units of the plant to be shut down due to safety concerns. The power plant was only reconnected to the grid in December of the same year. German imports helped to cover electricity requirements during the time the plant was not producing electricity.
In September and October 2018, Germany was a net importer from Denmark (870 GWh, 36 times as much as in the year before), Sweden (358 GWh, or 5 times higher) and Czechia (356 GWh, -52%). This was a total increase of 88% compared with the previous year. The clear increase in trading with Denmark was the result of measures agreed in 2017 for the German-Danish border that enable more trading between the two countries while guaranteeing network security. The agreed minimum import capacity from Denmark has been 700 MW since January 2018. Electricity trades between Sweden and Germany rely on the Baltic Cable, the only direct electricity link between the two countries. If it is unusable because of a technical fault or planned maintenance, trading cannot take place. Last year, that was the case from the end of August to the end of September as well as on other, isolated occasions. The graph below shows all electricity imports and exports.
The chart gives an overview of Germany's commercial electricity trade. (Gross) exports are shown above the zero line while (gross) imports are shown below the zero line. The black line shows total net exports.
The wholesale price in Germany
Wholesale prices for electricity were significantly higher compared with a year earlier. In September and October, the hourly products on the EPEX SPOT day-ahead market were traded at between -6.79 euros and 112.66 euros per megawatt hour (€/MWh), resulting in an average price of €53.96/MWh. This corresponded to a year-on-year increase of €22.71/MWh. These prices were due to higher costs for gas, oil and CO2 as well as storms in the previous year, some of which were very strong and one of which, "Herwart", occurred over a weekend (28-29 October 2017). That weekend alone saw 31 hours with negative prices, because electricity consumption is usually lower on Saturdays and Sundays than during the week and a lot of wind power was generated as well. By contrast, there were only nine hours with negative prices in the same period of 2018. Negative prices therefore weighed less on the average price in September and October 2018 than in the year before.
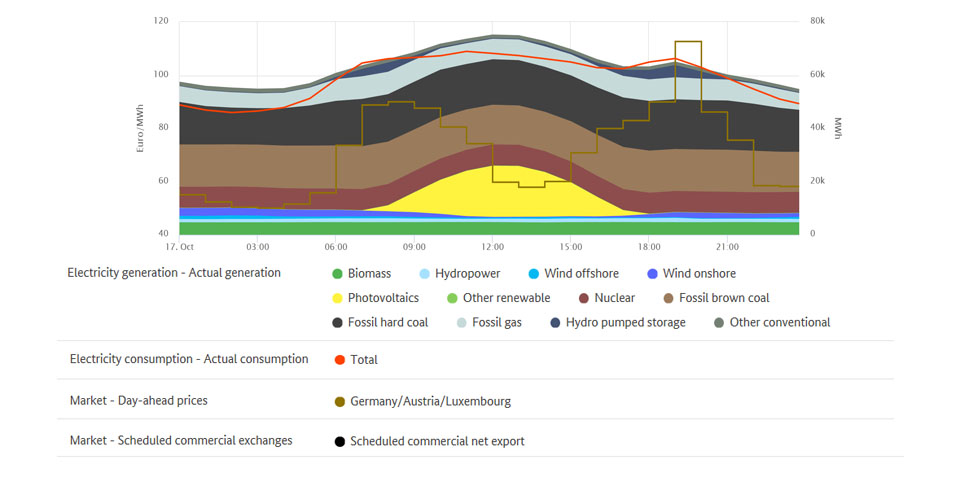
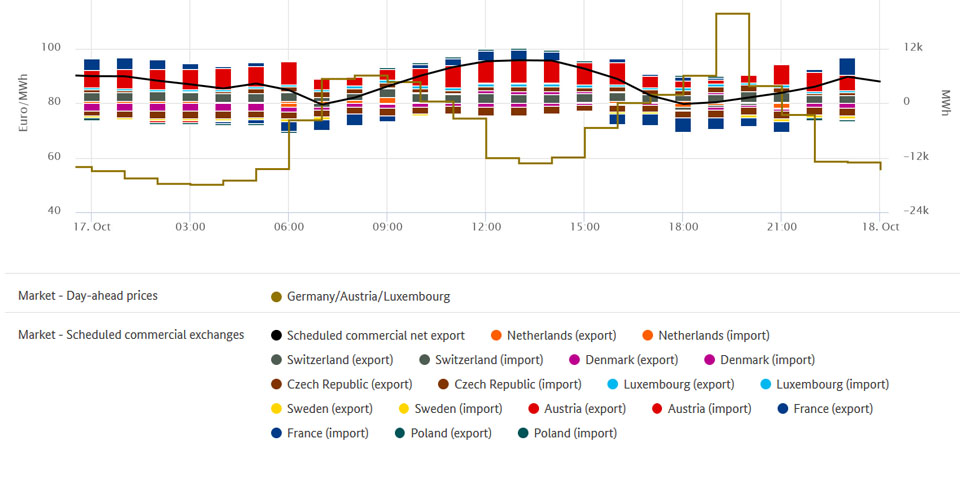
On the day-ahead market exchange, the highest price of the two-month period, €112.66/MWh, was recorded on Wednesday, 17 October, between 7pm and 8pm, when a lack of wind coincided with the usual evening peak in consumption. The general price level in Europe was also high, so any imports could not bring the price down. These generally high prices led to 158 MWh of electricity being exported from Germany. Net exports went to Poland, Austria, Luxembourg and Switzerland, while net imports came primarily from France and Czechia.
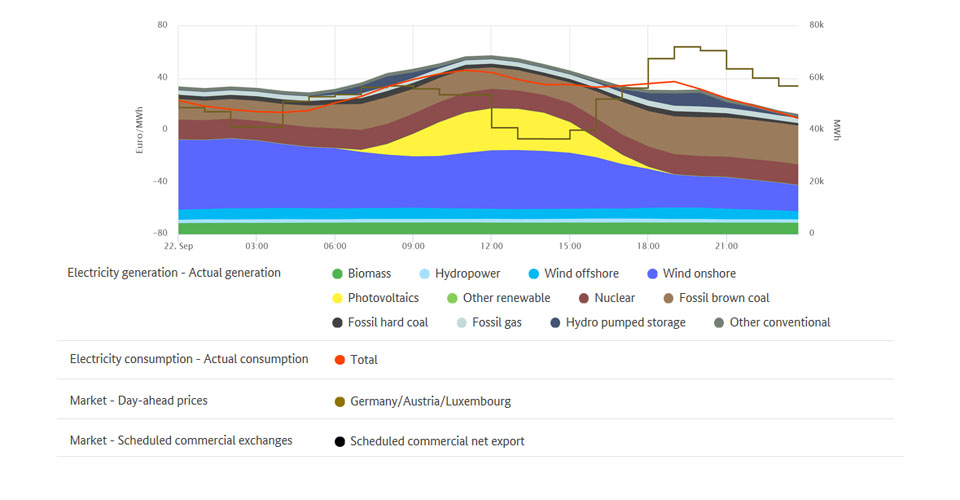
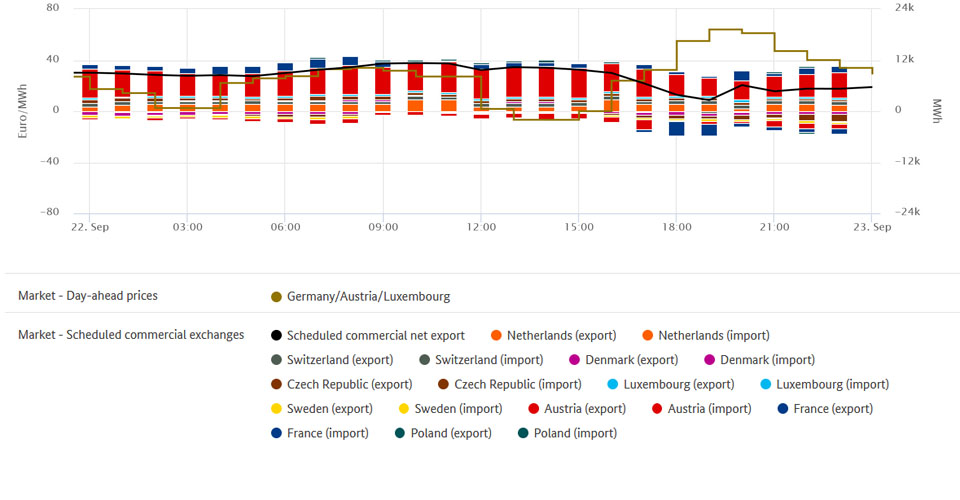
The lowest electricity price of -6.79 euros/MWh was recorded between 2pm and 3pm on Saturday, 22 September, when Germany exported a very large amount of electricity (10 GWh) to other countries. On that Saturday afternoon, many people were enjoying the sunny weather outside and not using their appliances at home. Moreover, industrial production had largely either been scaled back or halted completely, meaning that electricity consumption was low across the whole country. At the same time, wind and solar generation was high, so 81% of consumption was covered by renewable energies during that hour. Conventional generators reduced their output as far as was technically feasible for economic reasons, resulting in an only slightly negative price level.
Market data graphs gallery
-
Electricity generation in February and March 2018

-
The first half - Electricity generation and electricity trading in 2021
-
Highest renewable generation in any May on record - Electricity generation and electricity trading in May 2021
-
Trading with Norway now possible - Electricity generation and electricity trading in April 2021