Hint: This website is not optimized for your browser version.
High solar generation - Electricity generation and electricity trading in July 2020
13 August 2020 – Electricity generation and electricity consumption in Germany were down 6% and 8% respectively compared with the same month of the previous year. The average wholesale price was €30.06/MWh, which was lower than the average price in the same month of the previous year, although it was at its highest since January. Germany imported 322.4 GWh more electricity than it exported during July, making it an overall net importer.
Electricity generation from renewable and conventional energy sources totalled 38 TWh in July 2020 (2019: 40.2 TWh). While generation from conventional sources was 14% lower than in July 2019, generation from renewable sources was 5.7% higher.
Electricity consumption was 37.3 TWh in the month, corresponding to a year-on-year decline of 7.9%.
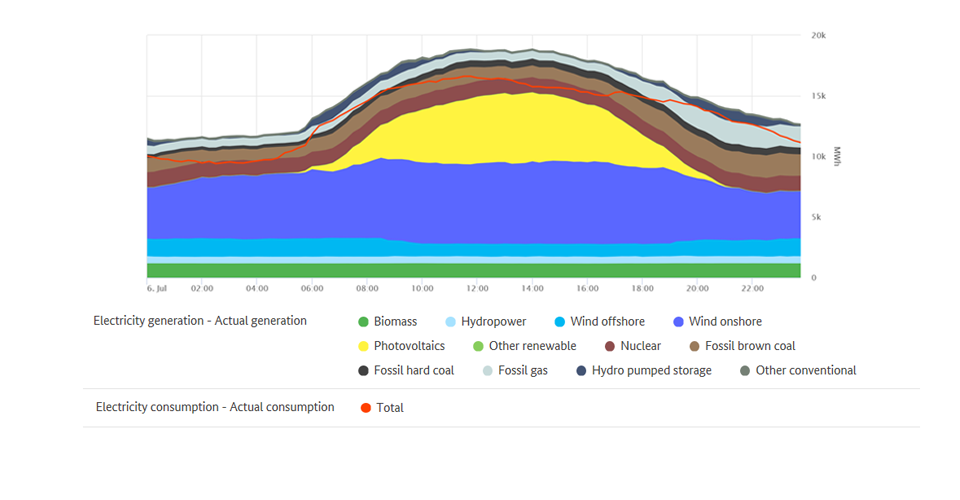
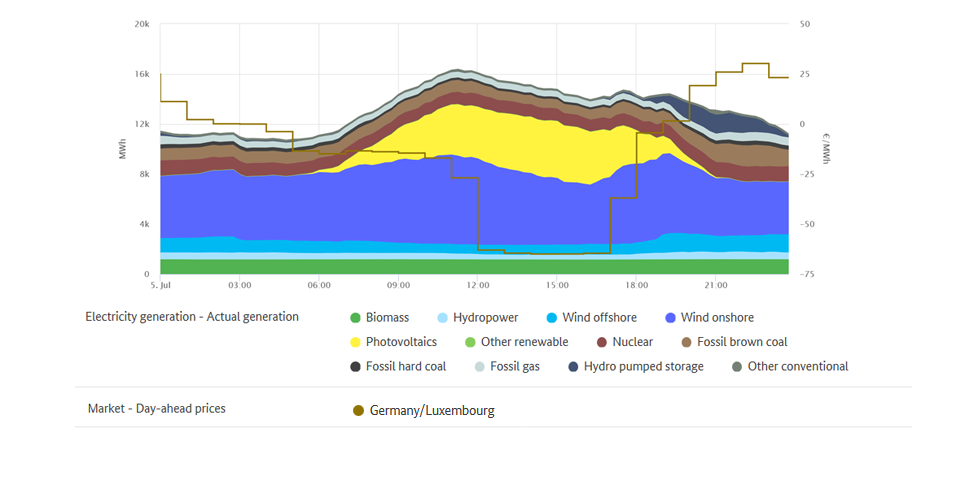
The chart illustrates electricity generation and consumption in Germany in the month of July.
The decrease in electricity generation from conventional sources is mainly due to the greatly reduced use of black coal (-52%), lignite (-22%) and nuclear power (-22%). By contrast, there was a 22% rise in generation from natural gas.
One possible reason for the overall lower electricity generation could be the decrease in electricity consumption during the coronavirus pandemic. There are also other factors in individual plant dispatch planning in the European electricity market, for example fuel costs or CO2 certificate prices, which impact the relative costs of a country’s fossil electricity generation. Changes in the installed and available capacity may not be disregarded either.
On Tuesday 28 July between 12pm and 1pm, when electricity consumption was high at 64.4 GWh, total electricity generation reached its maximum of just under 76.7 GWh, which was 1.7% beneath the maximum value in the same month a year earlier. Electricity generation recorded its lowest level of 30.5 GWh on Sunday 12 July between 5am and 6am, when electricity consumption was also low at 33.0 GWh.
Highest and lowest outputs of renewable electricity generation
Electricity generation from renewable energy sources reached its highest level of 60.5 GWh on Tuesday 6 July between 1pm and 2pm. Photovoltaic systems generated 22.8 GWh (38%), onshore wind farms 26.7 GWh (44%) and offshore wind farms 4.2 GWh (7%). The remaining 6.8 GWh (11%) came from biomass, hydropower and other renewables. During this time, electricity consumption was 64.7 GWh. Renewables therefore covered nearly 93.5% of electricity consumption, ie the grid load, during this hour.
On Saturday 4 July from 9.45am to 5.15pm and on Sunday 5 July from 7.15am to 5pm, generation from renewables covered all of the electricity consumed.
Generation from renewable sources fell to its lowest level of 7.5 GWh on Saturday 18 July between 9pm and 10pm, when electricity consumption was also low at 42.9 GWh. At 4.5 GWh, biomass accounted for the majority (60%) among the renewables; hydropower generated 2.1 GWh (28%); on and offshore wind farms together generated only 0.7 GWh (9%) and other renewables generated the remaining 0.2 GWh (3%).
The chart shows electricity consumption and renewable electricity generation on 4 and 5 July 2020. On those days renewables were able to fully meet demand (grid load) for many hours.
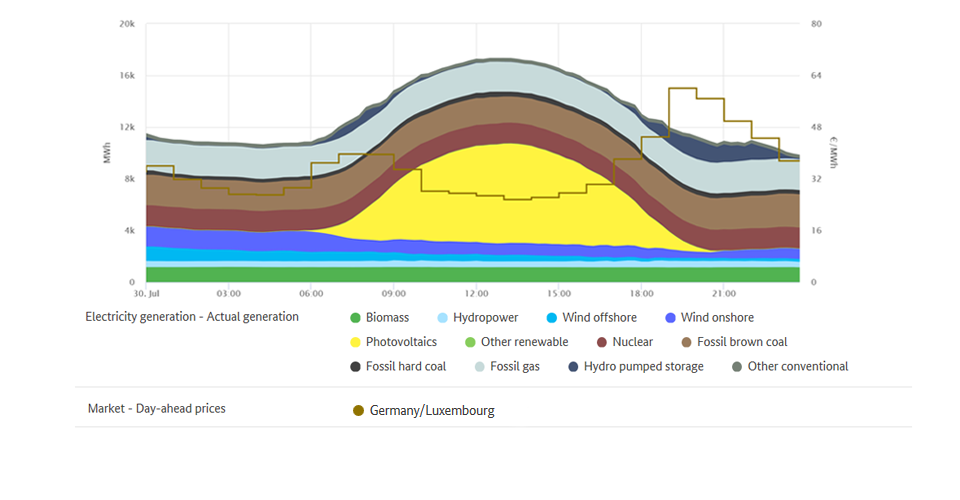
The wholesale electricity price in Germany
Wholesale prices for electricity fell from the previous year. In July, the hourly products on the EPEX Spot day-ahead market were traded at between minus 64.99 and plus 60.02 euros per megawatt hour (€/MWh), resulting in an average price of €30.06/MWh. This was on average €9.62 lower than in the same month of the previous year (July 2019: €39.69/MWh), although it was the highest price since January.
The lowest exchange price was recorded between 2pm and 3pm on Sunday, 5 July and was minus 64.99 euros per megawatt hour. During this time, the total electricity consumption of 46.7 GWh was met completely by the higher level of renewable generation of 49.4 GWh.
Negative electricity prices were recorded in 24 of the 744 hours of trading, although there had not been any in the same month last year.
The "six-hour rule", according to which larger new installations receiving payments under the Renewable Energy Sources Act (EEG) and selling electricity do not receive payment in such periods, only came into play on Sunday 5 July. On that day there were 16 consecutive hours of negative prices. Under the rule, only if the day-ahead price on the electricity exchange is negative for a period of at least six consecutive hours do the installation operators not receive the market premium as from the first hour in the period with negative prices.
On the day-ahead market, the highest price of the past month of €60.02/MWh was recorded on Thursday 30 July between 7pm and 8pm. In this hour, electricity consumption was high at 53.8 GWh and there was a low level of generation from renewables (13.4 GWh). The electricity market reacts to this kind of situation by taking power from storage facilities (such as pumped storage stations), reducing the consumption of flexible loads and increasing the use of conventional power stations.
Wholesale prices in Germany | ||
July 2020 | July 2019 | |
Average [€/MWh] | 30.06 | 39.69 |
Minimum [€/MWh] | -64.99 | 6.77 |
Maximum [€/MWh] | 60.02 | 74.06 |
Number of hours with negative prices | 24 | 0 |
data basis: smard.de
Commercial foreign trade
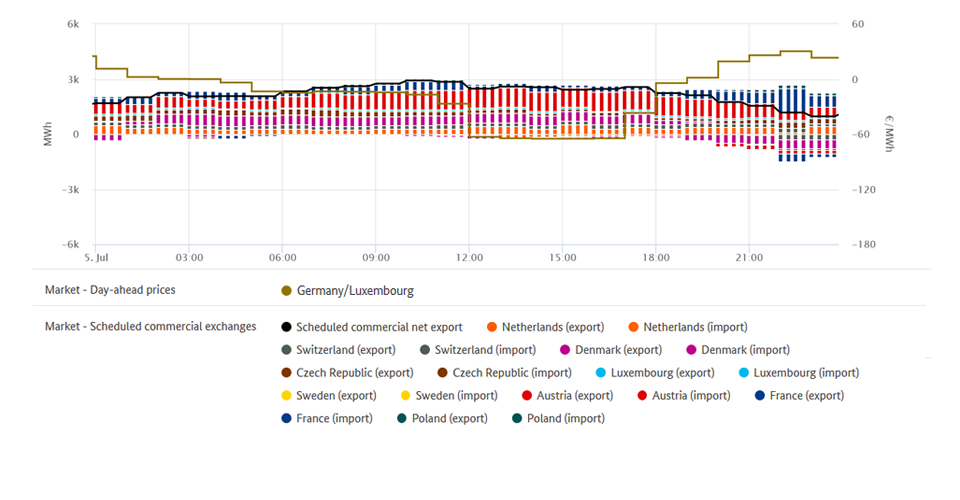
Germany imported a total of 322.4 GWh more electricity than it exported in July, making it an overall net importer, as was the case in May (2,079 GWh) and June (232.8 GWh). It had been a net exporter in July 2019, exporting 273.4 GWh.
Changes in imports and exports are the result of frequent price fluctuations, which reflect the interaction of supply and demand in the respective countries and across borders. These fluctuations are part of normal market activity in European wholesale electricity trading.
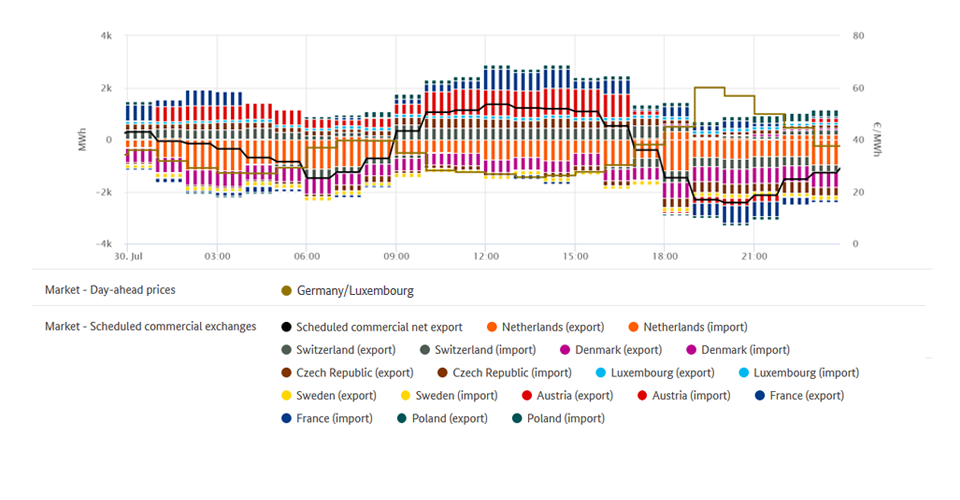
A total of 2.1 TWh was exported, which corresponds to 5.5% of the electricity that was produced in this period in Germany and nearly twice the amount exported in June (1.2 TWh). The main customer for Germany's net exports of electricity (exports less imports) in July was Austria, which accounted for 848 GWh (down 46.5% compared with the previous year). Czechia followed in second place with 463 GWh (up 6.8%), ahead of Poland with 340 GWh net (up 31.5%).
One reason for the large increase in exports to Poland was the number of hours in which electricity from Germany was cheaper (725 of the 744 hours of trading). Fossil fuels dominate electricity generation in Poland. Black coal alone makes up 51% of the installed generating capacity, lignite another 17%. That makes the electricity traded in Poland relatively expensive, partly due to the increased prices for CO2 certificates.
Trade with Austria is a different story; there, renewable energy, particularly hydropower, makes up the majority of installed capacity. Although Austrian electricity consumption fell in July (-360 GWh or -7.2% year-on-year), generation there increased by 407 GWh or 8.5%. Consequently, Austria imported less electricity from its neighbours than it had done in the previous year.
Germany was a net importer from four countries: the Netherlands (1,216 GWh), Denmark (980 GWh), Sweden (228 GWh) and France (10 GWh).
One reason why Germany went from being a net exporter in July 2019 to a net importer this year could be the number of hours in which the wholesale price was lower in neighbouring countries. Electricity from Germany was more expensive than electricity from the Netherlands in 368 hours (July 2019: 187 hours), from Denmark's two control areas in 329 and 311 hours respectively (2019: 184 and 185 hours) and from Sweden in 530 hours (2019: 490 hours).
The chart gives an overview of Germany's commercial electricity trade. (Gross) exports are shown above the zero line while (gross) imports are shown below the zero line.
Market data graphs gallery
-
The electricity market in the third quarter of 2023
Wholesale electricity price again lower

-
The electricity market in the second quarter of 2023
High feed-in from solar
-
Analysis of the past quarter
Electricity market in the fourth quarter of 2022
-
Electricity market topics
The electricity market in 2022