Hint: This website is not optimized for your browser version.
An overview of the electricity market at Christmas
Christmas is just around the corner. What does electricity consumption typically look like over a Christmas holiday, and what are its special characteristics?

This year Christmas Eve falls on a Friday, followed by Christmas Day and Boxing Day on Saturday and Sunday. As everyone knows, this is not always the case. Unlike the Easter holiday, Christmas Eve, Christmas Day and Boxing Day fall on different days of the week every year. Depending on whether or not the holiday is on a weekday, this can have different effects on electricity consumption, particularly on the day before Christmas Eve (23 December) and the first day after the Christmas holiday (27 December).
Looking at electricity consumption (the grid load) since 2015 on the days from 23 to 27 December, there are similarities despite the fact that the dates fall on different days of the week. Electricity consumption was almost always at its highest on 23 December. Except in 2018, when the 23rd was a Sunday and thus not a working day.
![Actual consumption from 23-27 December since 2015 [GWh]](https://www.smard.de/resource/blob/206766/99307aca743595daf44ae4f81637ce6a/bild1-data.png)
Overall, electricity consumption is lower on the 24th (1,150.9 GWh) than on the 23rd by an average of 126.2 GWh. However, when comparing the days of the Christmas holiday (24 26 December), consumption is highest on the 24th. This is mainly because the 24th is not a public holiday.
The average consumption on Christmas Day is 1,088.4 GWh and 1,103.4 GWh on Boxing Day, meaning that consumption on those days is normally less than on Christmas Eve. Especially on holidays such as Christmas and on weekends, consumption is usually lower than on working days since trade, businesses and industry limit their activities. On 27 December, which was often a regular working day, electricity consumption (1,215.3 GWh) begins returning to pre-holiday levels.
On the other days in December, electricity consumption averaged 1,427.5 GWh per day.
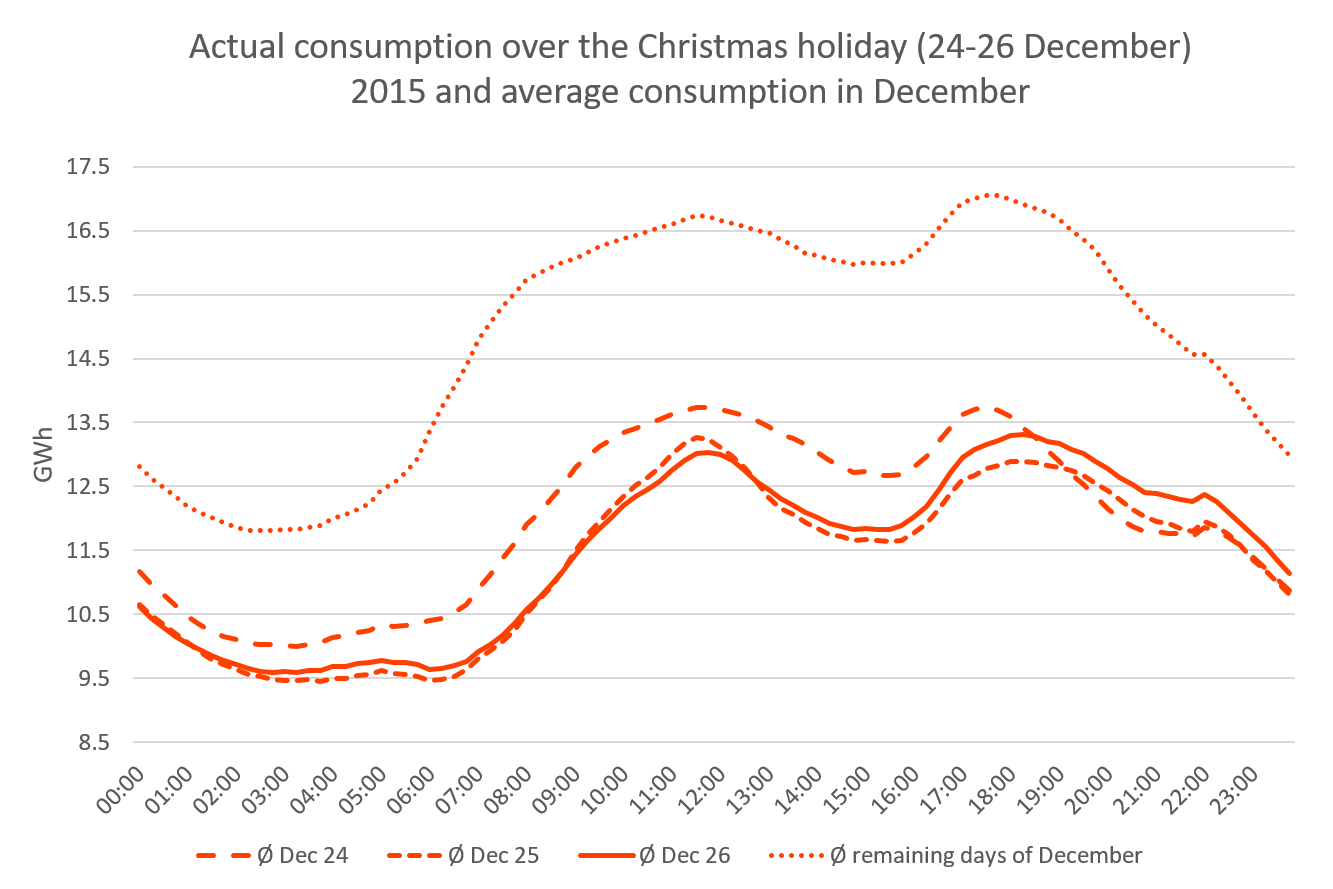
The average course of consumption curves over the Christmas holiday resembles the rest of December: Electricity consumption increases throughout the morning hours until around 12pm. After that, consumption decreases until around 4pm before it steadily rises until close to 6pm. Then consumption declines again for the remaining hours of the day. There is, however, something peculiar about the curve showing average consumption on the 24th of December: it flattens out more abruptly in the evening hours, with consumption from around 7:30pm until 10pm falling below the values of the 25th and 26th of December.
Overall, however, consumption levels of those three days are different from the rest of December, as illustrated in the chart below.
Generation from renewable energy sources
Last year, generation from renewables totalled 1,870 GWh over the Christmas holiday (24 26 December). Electricity consumption was 3,400 GWh, with renewables covering 55% of the grid load. In addition to favourable weather conditions, a year-by-year comparison shows that installed generating capacity, which has increased by 40.8 GW since 2015, also plays a role in renewable output.
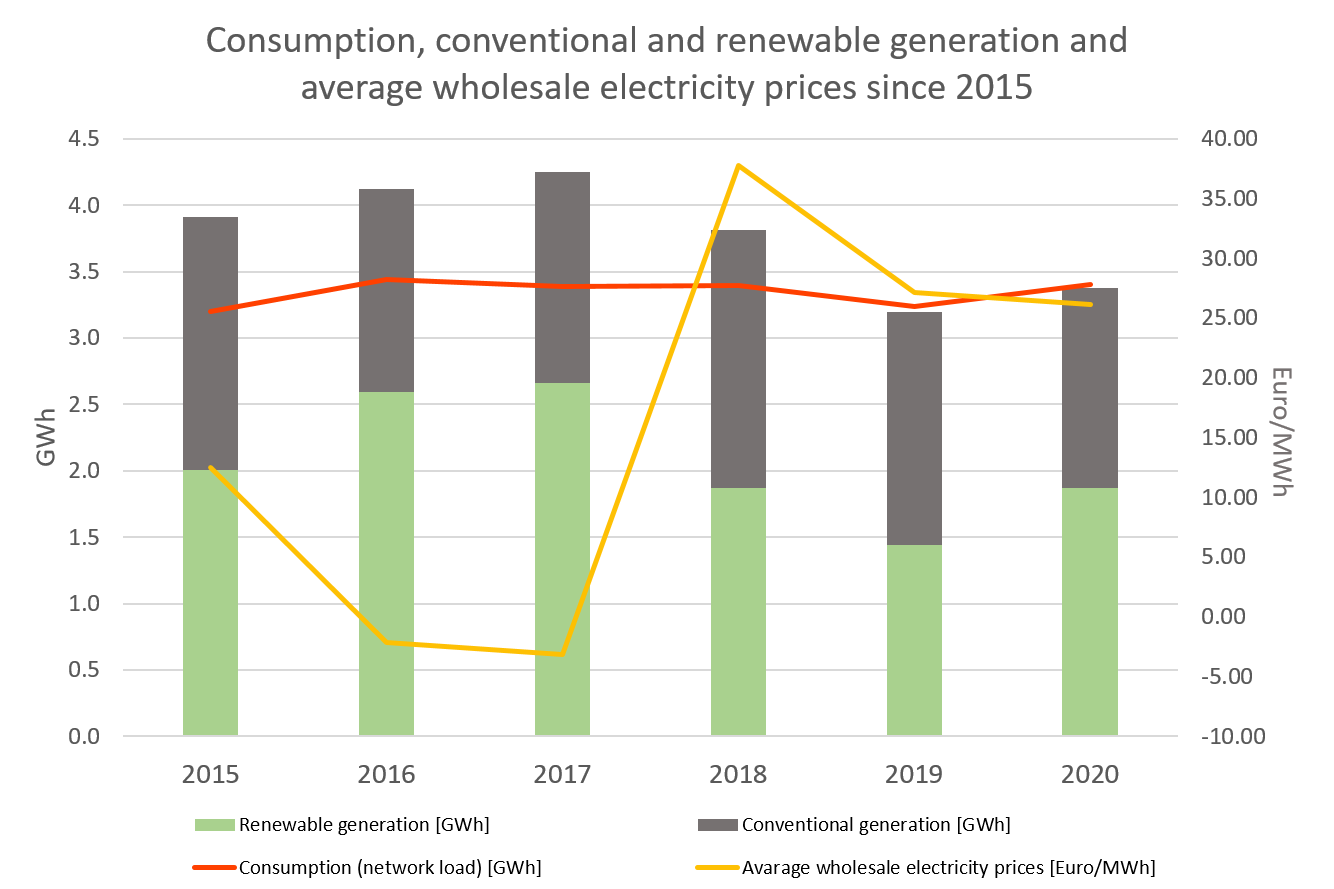
Current forecasts indicate that generation from renewable energy sources over this Christmas holiday may be less than last year, meaning that renewables would also cover less of the grid load.
Wholesale electricity prices during the Christmas holiday
A reduced demand for electricity usually means a lower price. Last year the average wholesale price of electricity over the three-day Christmas holiday was €26.13/MWh, which was lower than the average price for the month of December (€43.52/MWh). The lowest price (minus €10.08/MWh) of last year's Christmas holiday was registered on 26 December. Between 11pm and 12am, a high level of renewable generation (41.7 GWh) coincided with a low level of power consumption (49.7 GWh). During this hour, renewables covered around 84% of the grid load.
German wholesale electricity prices during the Christmas holiday in €/MWh | |||||||
2015 | 2016 | 2017 | 2018 | 2019 | 2020 | Average | |
Ø 24-26 December | 12.46 | -2.16 | -3.19 | 37.75 | 27.13 | 26.13 | 16.35 |
Minimum | -15.33 | -67.09 | -61.41 | -7.30 | -7.45 | -10.08 | -28.11 |
Maximum | 29.22 | 21.00 | 27.59 | 69.80 | 42.64 | 51.73 | 40.33 |
December (including 24-26 December) | 27.78 | 37.48 | 30.77 | 48.13 | 31.97 | 43.52 | 36.61 |
Over the course of 2021, wholesale electricity prices were trending upward. A chart showing this trend is available here.
In the Market data visuals section you can view this year's wholesale electricity prices during the Christmas holiday as they develop. You can also look at electricity consumption and renewable energy generation in nearly real time.