Hint: This website is not optimized for your browser version.
Less electricity from nuclear power - Electricity generation and electricity trading in January 2020
17 February 2020 – Electricity generation in Germany has declined over the past year by 9.4%. The average wholesale price was €35.03/MWh, which was lower than the average price from the same month one year ago. Commercial net exports dropped by 42.7%.

Electricity generation from renewable and conventional sources totalled 46.6 TWh in January (2019: 51.4 TWh). While electricity generation from conventional sources dropped by 20.3% compared to January 2019, electricity generation from renewable sources rose by 7.1%.
On Wednesday 8 January, between 11am and 12pm, total electricity generation reached its maximum of 79.3 GWh, which was 4.9% below the maximum value from the same month one year ago. Electricity generation reached its lowest level of 37.6 GWh on Wednesday 1 January between 1am and 2am.
Closure of Philippsburg 2
After 35 years in operation, the Philippsburg 2 nuclear power plant, with an installed electrical capacity of 1,468 megawatts, was shut down and permanently taken off the grid on 31 December. The Philippsburg 1 block has been out of operation since 2011. With the closure of Philippsburg 2, there are only six nuclear power plants still in operation in Germany; they will also be shut down at the end of 2021 and 2022. Declining from 6.8 GWh to 5.8 GWh, total electricity generation from commercial usage of nuclear power fell by 14.8% compared to the same month one year ago.
The chart illustrates the progression of electricity generation by the Philippsburg 2 nuclear power plant from 28 December 2019 to 4 January 2020.
Highest and lowest outputs of renewable electricity generation
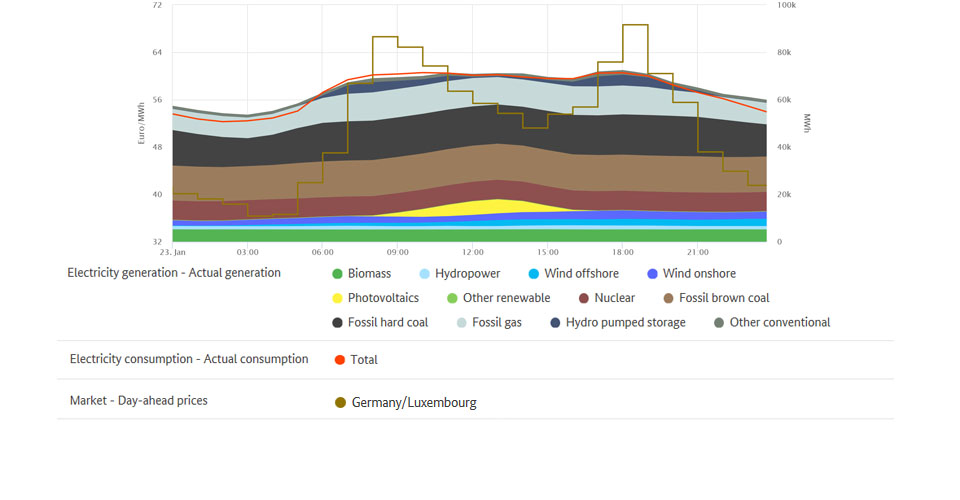
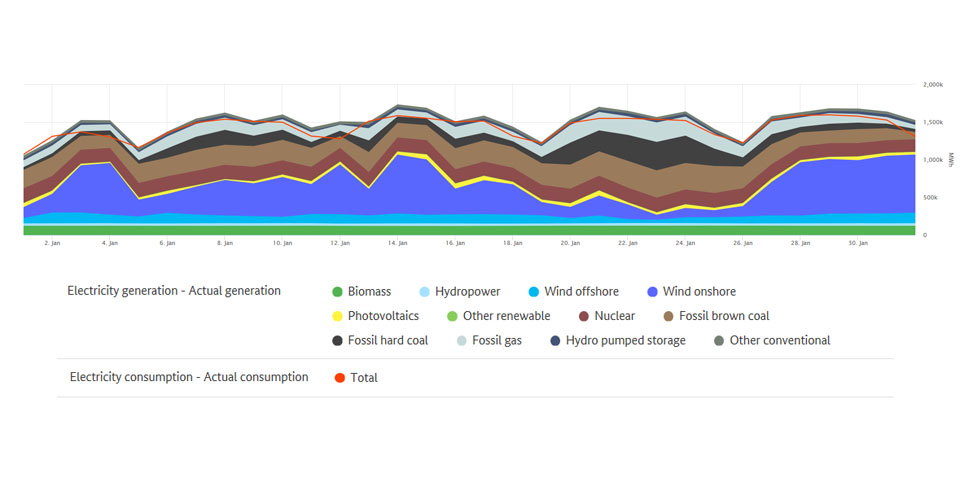
Electricity generation from renewable energy sources reached its highest level of 53 GWh on Wednesday 15 January between 12pm and 1pm. Onshore wind farms generated 28.8 GWh (54.3%), offshore wind farms generated 4.5 GWh (8.5%), and photovoltaic systems generated 13.3 GWh (25.2%). The remaining 6.4 GWh came from biomass, hydropower and other renewables. Electricity generation from renewable energy sources reached its lowest level of 8.7 GWh on Thursday 23 January between 1am and 2am.
The graph shows the day when renewable electricity generation was at its highest. The red line shows consumption.
The wholesale price in Germany
Compared with the previous year, wholesale prices for electricity fell. In July and August, the hourly products on the EPEX Spot day-ahead market were traded at between minus 8.77 and 68.64 euros per megawatt hour (€/MWh), resulting in an average of €35.03/MWh. That was €14.13/MWh less than in the same period of last year. This could be due to, among other things, the higher feed-in from renewable energy sources and the decrease in electricity consumption by 1.2 TWh.
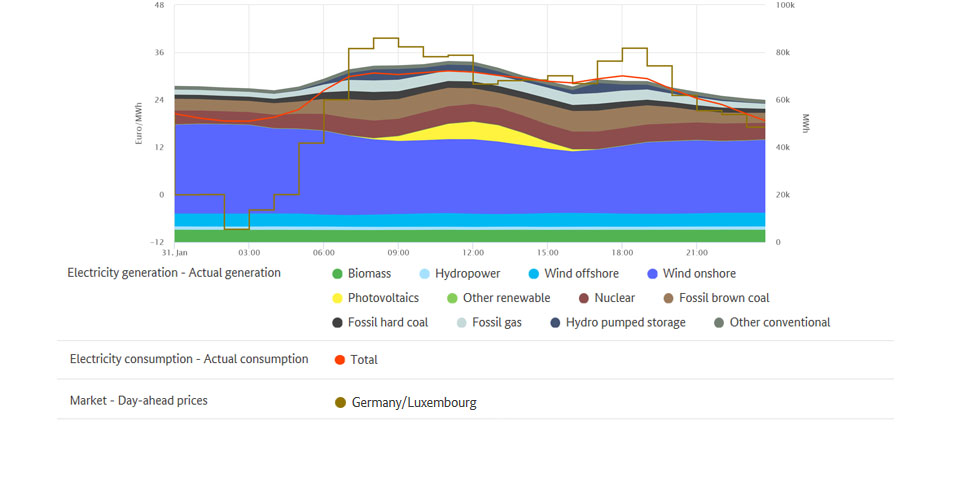
The lowest exchange price occurred between 2am and 3am on Friday 31 January and was minus 8.77 euros per megawatt hour (€/MWh). During this time power consumption was low and renewable energy generation – especially from wind power stations on land – was high, generating around 29 GWh.
Compared to the same month one year ago, the number of hours of negative electricity prices decreased from 34 to 3 of the 751 traded hours. For the first time since 2017 there were no negative electricity prices on New Year’s Day. In 2019 there were 16 hours of negative electricity prices on New Year’s Day alone due to high electricity generation from onshore wind power stations. Electricity generation within one hour from onshore wind power stations reached a high of 36.3 GWh on New Year’s Day 2019; this year its highest level was 9.9 GWh. There were no negative prices on the electricity exchange until 31 January.
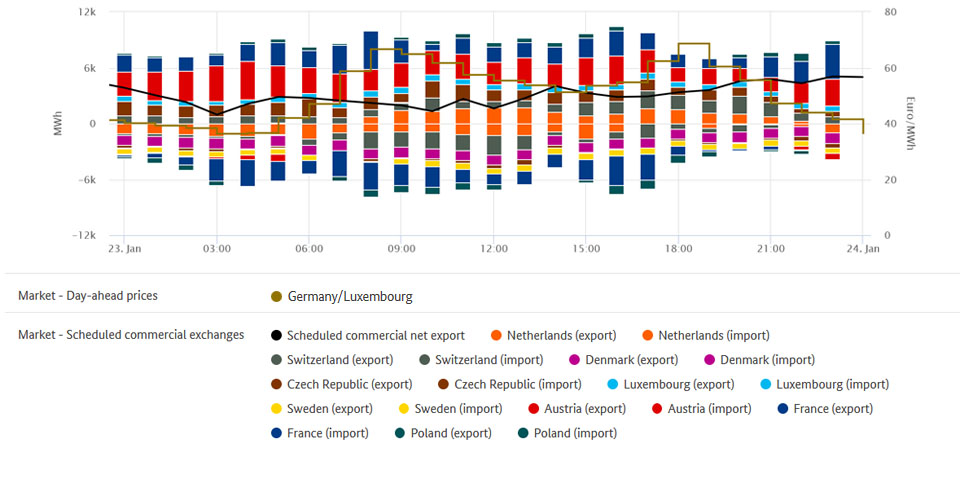
On the day-ahead market exchange, the highest price of the past month of €68.64/MWh was recorded on Thursday, 23 January, between 6pm and 7pm. In this hour, power consumption was high and there was a low level of generation from renewables. The electricity market reacts to this kind of situation by taking power from storage facilities (eg pumped storage stations), reducing the consumption of flexible loads and increasing use of conventional power stations with higher marginal costs, in particular gas-fired power plants.
Wholesale prices in Germany | ||
| January 2020 | January 2019 |
Average [Euro/MWh] | 35.03 | 49.39 |
Minimum [Euro/MWh] | -8.77 | -48.93 |
Maximum [Euro/MWh] | 68.64 | 121.46 |
Number of hours with negative prices | 3 | 34 |
Data basis: smard.de
Commercial foreign trade
Germany’s commercial net exports for January totalled 4,235 GWh, which is 9.1% of all electricity produced in Germany in this time frame. In comparison with the previous year, net exports fell by 42.7%. The main customer for Germany's net exports of electricity (exports less imports) was Austria, which accounted for 2,995 GWh (up 24.9% compared with the previous year). France followed in second place with 983 GWh (down 60%), ahead of Czechia with 772 GWh (up 107.6%).
Germany was a net importer from Denmark and Sweden, from which Germany took a total of 995.5 GWh and 384.8 GWh, respectively. This is a total increase of 281 or 1,230% compared with the previous year.
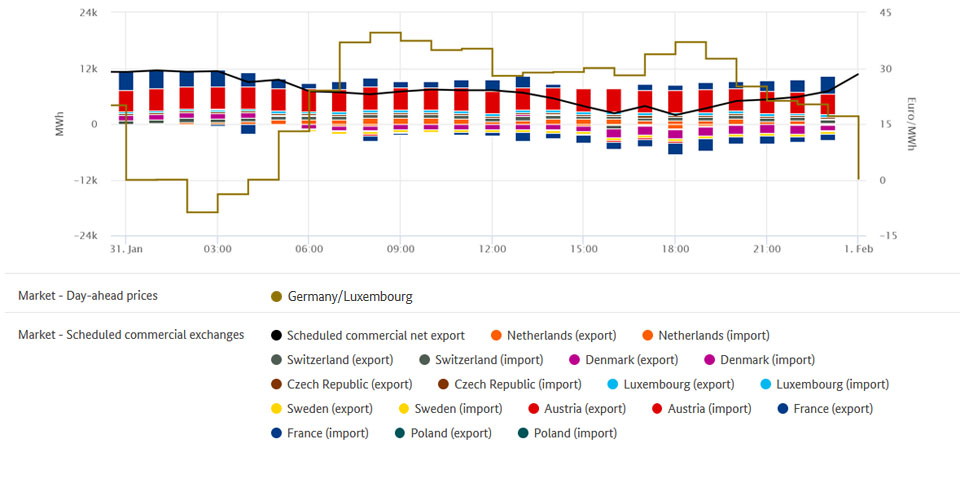
The chart gives an overview of Germany's commercial electricity trade. (Gross) exports are shown above the zero line while (gross) imports are shown below the zero line.
Changes in imports and exports are the result of frequent price fluctuations, which reflect the interaction of supply and demand in the respective countries and across borders. These fluctuations are part of normal market activity in the European wholesale electricity trade.
One reason for the strong rise in imports from Sweden could be the number of hours in which electricity was less expensive there than in Germany. Electricity was less expensive in Sweden than in Germany for 627 of the 744 traded hours. In the same month a year ago it was less expensive for only 195 hours, and German electricity was less expensive for 399 hours. While there was a daily alternating of electricity imports and exports between Sweden and Germany in 2019, this January Germany - with the exception of five days - almost continuously imported electricity from Sweden.
The rise in imports from Denmark could be - as with Sweden - due to the largely lower electricity prices in both of the Danish zones, and also due to the gradual increase in trading capacity between Germany and western Denmark.
Following the decision of the European Commission in December of last year, the implementation was announced for this January. The transmission system operator must implement the first increase from 700 MW to 1,300 MW in the first six months. In the course of the network expansion the guaranteed capacity should then increase to 2,625 MW by 2026.
Market data graphs gallery