Hint: This website is not optimized for your browser version.
The first half - Electricity generation and electricity trading in 2021
1 July 2021 – Electricity consumption in the first half of 2021 was up 4.7 percent (%) on the same period last year. Renewable generation was 12.1% lower and covered 44.4% of the grid load. Germany was a net exporter in commercial foreign trade.

Two particular factors should be kept in mind when reading the figures below for electricity consumption, generation, wholesale prices and trading. Firstly, last year, in particular, the electricity market – like nearly all areas of public life and the economy – was affected by the restrictions imposed to contain the Covid-19 pandemic. Secondly, the first half of last year had one calendar day more than the first half of this year because 2020 was a leap year.
Electricity consumption higher
Total electricity consumption (grid load) in the first half of this year was 4.7% higher than in the first half of 2020. In January, consumption was up 1.8% on the same month last year. Consumption was then 2.3% down year-on-year in February, but this was followed by a slight year-on-year increase in March (+5.6%) and finally a significant year-on-year increase in April (+10.7%). Consumption in May was then up year-on-year by 6.4% and in June by 8.0%.
Last year, the measures taken from mid-March onwards to contain the Covid-19 pandemic had led to a significant decrease in consumption. Consumption in the first six months of 2020 amounted to 240.8 terawatt hours (TWh). In the first half of this year, consumption was less affected by the measures to contain the Covid-19 pandemic and at 252.2 TWh was higher than in 2019 (248.5 TWh).
Renewable generation lower
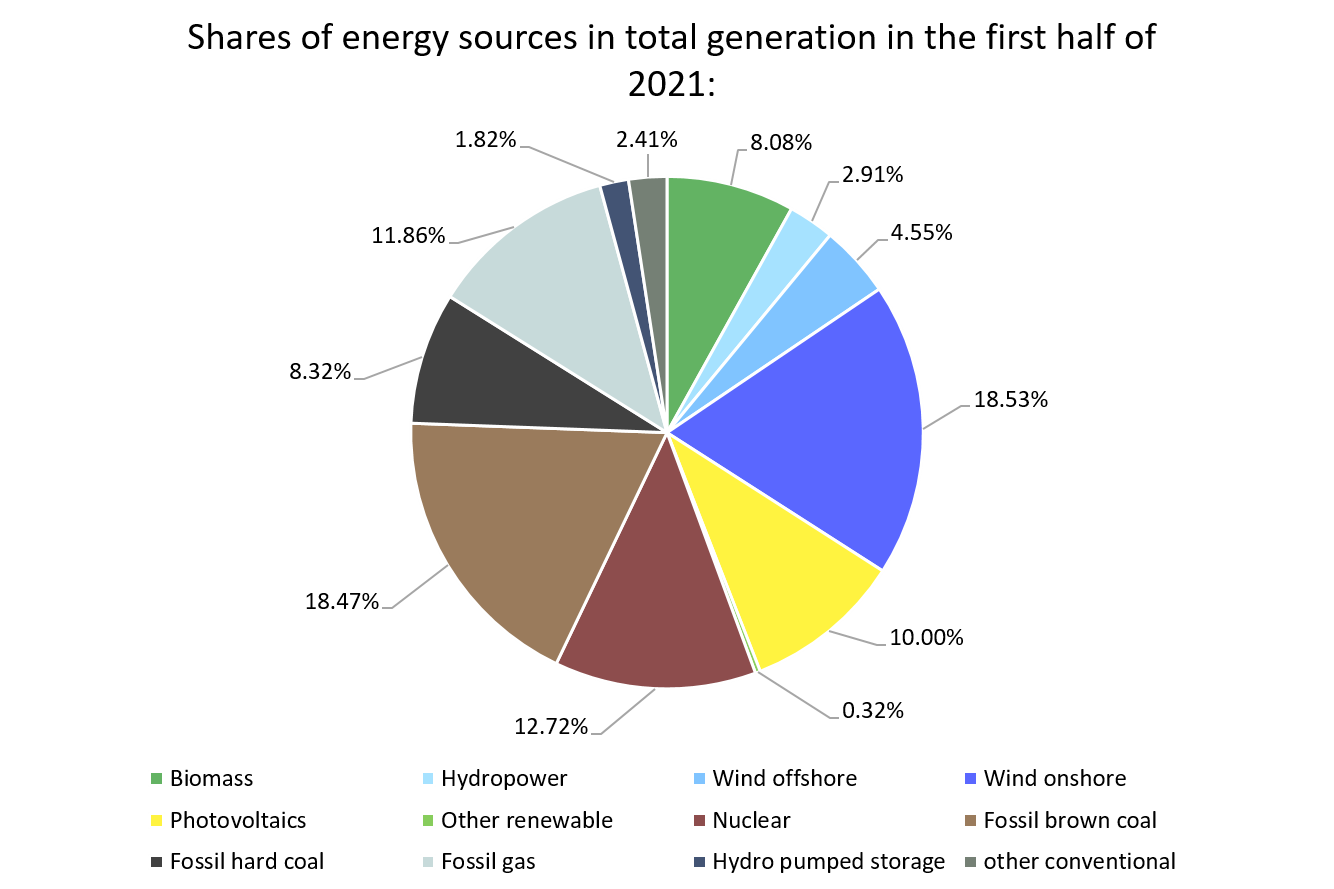
Renewable generation in the first half of this year totalled 112.0 TWh, down 12.1% on the same period last year. Generation from wind, in particular, was lower. Offshore wind generation was down by around 21.3% at 46.7 TWh and onshore wind generation was down by around 16.5% at 11.5 TWh. Hydro generation was down by 4.1% at 7.3 TWh and biomass was down by 1.2% at 20.4 TWh. There was a slight year-on-year increase in solar photovoltaic (PV) generation to 25.2 TWh (+0.5%) and in generation from other renewable sources to 0.8 TWh (+1.7%).
The overall figures for renewable generation are comparatively lower also because output in the first half of 2020 was unusually high. Renewable generation in the first half of this year was only 4.8% lower than in the first half of 2019, for example.
There was a high level of generation from wind in January and February 2020. In February alone, storms led to a wind generation of around 16 TWh. Total renewable generation was 26.7 TWh and the highest in a single month since at least 2015. There was also an above-average output from renewables on the extra leap day. By contrast, renewable generation this February totalled 17.4 TWh and was therefore 34.7% lower. In March 2020, many hours of sunshine had then led to a high level of solar PV generation at 4.1 TWh. Generation from wind was also about 2.7 TWh higher.
In April 2021, renewable generation was down only 0.4% on last April at 19.6 TWh. In May 2021, generation from renewables was the highest in any May and was up by 12.6% on last May at 21.3 TWh. Two storms were particular contributing factors.
Overall, generation from renewables covered 44.4% of the electricity consumption (grid load) in the first half of this year. This compares to 52.9% in the first half of 2020.
| Electricity consumption (grid load) [GWh] | Renewabler generation [GWh] | Conventional generation [GWh] | ||||
Month | 2021 | Change | 2021 | Change | 2021 | Change |
January | 45,929 | +1.8% | 16,677 | -23.6% | 29,376 | +13.3% |
February | 41,979 | -2.9% | 17,427 | -34.7% | 23,514 | +28.0% |
March | 45,097 | +5.6% | 20,417 | -12.2% | 24,668 | +20.4% |
April | 40,349 | +10.7% | 19,625 | -0.4% | 22,518 | +44.7% |
May | 39,448 | +6.4% | 21,248 | +12.6% | 18,109 | +12.6% |
June | 39,344 | +8.0% | 16,578 | -2.1% | 22,029 | +19.1% |
Total | 252,146 | +4.7% | 111,972 | -12.1% | 140,214 | +22.0% |
The share of electricity consumption that could not be covered by wind or solar PV generation is referred to as the "residual load". If wind and solar generation is high, the residual load is low; and if wind and solar generation is low, the residual load is high. The residual load in the first half of 2021 was 18.4% higher than in the same period last year.
The chart shows the actual electricity consumption and the residual load in the first half of the year, with figures for each week in the period.
Conventional generation higher
Overall, generation from conventional sources in the first half of 2021 was 22.0% higher than in the first half of last year. Hard coal-fired generation, in particular, was higher at 21.0 TWh (+49.8%). Lignite-fired generation was also higher than last year at 46.6 TWh (+38.2%). Likewise, generation from natural gas was up on the first half of 2020 at 29.9 TWh (+11.9%), as was nuclear generation at 32.1 TWh (+6.8%) and generation using other conventional sources at 6.1 TWh (+23.7%). Only generation from pumped storage was lower at 4.6 TWh (-16.7%).
The main reason for the higher level of generation from conventional sources was the comparatively higher level of electricity consumption coupled with the lower level of generation from renewables.
This is reflected accordingly in the residual load. Another factor was the high demand from neighbouring countries, which led to an even higher demand for electricity.
Wholesale electricity prices in Germany higher
The average wholesale electricity price in the first half of this year was 54.96 euros per megawatt hour (€/MWh) and more than twice the average in the first half of last year (€23.42/MWh). By way of comparison: the average price for the period from January to June 2019 was €38.33/MWh, which was then the highest average price in the first half of any year since at least 2015.
While no prices higher than €100/MWh were recorded in the first half of 2020, they were recorded in 71 of the 4,343 hours of trading in the first half of this year. This resulted in a higher average. Conversely, there were more than twice as many negative prices in the first half of 2020 than in 2021, which led to a lower average.
In the first half of 2020, the "6-hour rule" took effect on 14 occasions, with the result that payments for renewable installations selling electricity directly were suspended for a total of 150 hours. Under the 6-hour rule, if the day-ahead price on the electricity exchange is negative for a period of at least 6 consecutive hours, the installation operators do not receive the market premium as from the first hour in the period with negative prices. In the first half of this year, the rule only took effect on 5 occasions, with payments being suspended for a total of 56 hours.
The revised Renewable Energy Sources Act (EEG) 2021 has shortened the period from 6 to 4 hours for new installations, with the 6-hour rule still applying to old installations. Negative prices were recorded in a period of at least 4 hours on 13 occasions, with payments being suspended for a total of 93 hours.
The main reason for the increase in wholesale prices compared with the first half of last year is the higher electricity consumption. Another reason is the significant increase in the price of EU carbon emission allowances since the beginning of the year, as well as in the spot prices for crude oil and natural gas. Higher prices for carbon allowances and fuel lead to higher marginal costs for electricity from fossil fuels. This is reflected in higher wholesale prices, in particular at times when renewable generation is low.
The lowest wholesale price was negative €69.00/MWh and was recorded on 22 May between 2pm and 3pm. During this hour, renewable generation was 54.1 GWh and higher than the electricity consumption of 52.3 GWh.
The highest wholesale price was €139.72/MWh and was recorded on 23 June between 7pm and 8pm. During this hour, the electricity consumption of 59.7 GWh coincided with a low level of renewable generation of 13.6 GWh.
Wholesale electricity prices in Germany | |||
1st half of 2021 | 1st half of 2020 | Change | |
Average [€/MWh] | 54.96 | 23.42 | +134.7% |
Minimum [€/MWh] | -69.00 | -83.94 | +17.8% |
Maximum [€/MWh] | 139.72 | 69.68 | +100.5% |
Number of hours with negative prices | 105 | 212 | -50.5% |
Number of hours with prices >€100/MWh | 71 | 0 | - |
A comparison between the average prices in Germany and in neighbouring countries shows a similar trend in prices. The highest average price in the first half of the year was €62.41/MWh and was recorded in Poland.
Wholesale prices in neighbouring countries (average in €/MWh) | ||||||||||||
Market area | Total | Denmark1 | Denmark2 | France | Netherlands | Poland | Sweden4 | Switzerland | Czechia | Austria | Belgium | Norway2 |
1st half of 2021 | 56.33 | 53.11 | 54.73 | 58.48 | 56.38 | 62.41 | 51.92 | 60.96 | 59.25 | 58.52 | 56.65 | 47.24 |
1st half of 2020 | 24.05/ 25.61* | 19.63 | 22.09 | 23.71 | 25.71 | 40.35 | 18.82 | 27.08 | 26.91 | 26.14 | 24.32 | 9.76 |
Change | 120.0%/ 134.2%* | +170.6% | +147.8% | +146.6% | +119.3% | +54.7% | +175.9% | +125.1% | +120.2% | +123.9% | +132.9% | +384.0% |
*excluding Belgium and Norway2
Commercial foreign trade – net exports higher
In the first half of this year, as last year, Germany was a net exporter of electricity. Net exports were up by 13.9% at 8.2 TWh (2020: 7.2 TWh). At what point in time electricity is imported or exported does not depend solely on supply and demand in the country in question, but also on the electricity prices in the other countries. The above comparison of wholesale prices shows that in the first half of this year it was worthwhile for some countries to buy electricity from Germany. Wholesale prices determined as a part of market coupling result from what are known as the relative generation costs, which vary over time. Wholesale prices are influenced by various factors, including the fluctuating wind and sun conditions, the cost of fuels and the cost of carbon emission allowances. Available transmission capacity at the national borders also plays a role.
In the first half of last year there was no electricity trading with Belgium or Norway. New interconnectors have since made this possible, however, with trading with Belgium starting on 18 November 2020 and full trading with Norway on 12 April 2021.
In the first half of this year, Germany was a net exporter of electricity to:
• Austria, with 8.29 TWh (-17.02% on 2020);
• France, with 2.21 TWh (net imports in 2020);
• Luxembourg, with 1.96 TWh (+6.87% on 2020);
• Switzerland, with 1.57 TWh (net imports in 2020);
• Czechia, with 0.90 TWh (-65.61% on 2020);
• Belgium, with 0.23 TWh (no trading in the first half of 2020);
• Poland, with 0.04 TWh (-97.70% on 2020).
Germany was a net importer of electricity from:
• the Netherlands, with 0.69 TWh (-5.99% on 2020);
• Sweden, with 0.84 TWh (-31.52% on 2020);
• Norway, with 1.48 TWh (no trading in the first half of 2020);
• Denmark, with 3.96 TWh (+36.53% on 2020).
The chart illustrates Germany's commercial electricity trade from January to June, with figures for each month in the period. (Gross) exports are shown above the zero line while (gross) imports are shown below the zero line.
___________________________________________________________________________________________________________
The figures presented in the chart and in the text may be updated at a later date. Further information about possible updates and data definitions is available (in German) in the user guide.