Hint: This website is not optimized for your browser version.
Energy market topics
Changes in the electricity mix
The proportions of different energy sources in Germany's electricity generation have changed in recent years.

The proportions of energy sources in electricity generation in Germany have changed over the years. This also has to do with the installed generation capacity, which specifies the maximum possible capacity of an installation. Added together, these result in the maximum possible capacity for each energy source in Germany.
The chart below shows the development since 2015. For conventional sources, the installed generation capacity dropped from 107,288 MW to 88,507 MW, while for renewables, it rose from 88,763 MW to 133,846 MW. The total installed generation capacity is 222,353 MW, higher than in 2015 when it was 196,051 MW.
Among the renewables, the installed capacity of photovoltaic installations saw particularly strong growth from 37,271 MW to 56,309 MW. Wind capacity rose even more sharply, from 37,701 MW to 55,630 MW for onshore and from 993 MW to 7,787 MW for offshore installations.
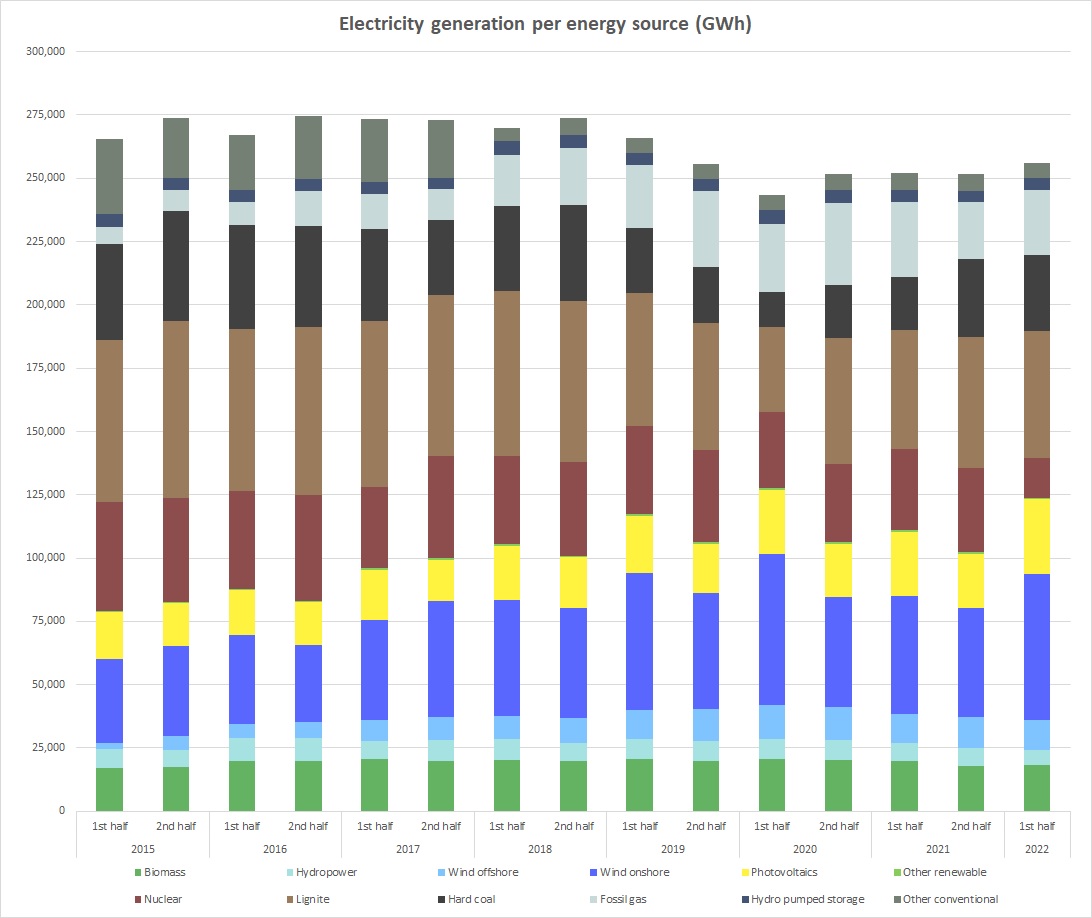
Changes in the electricity mix
The developments mentioned tend to be reflected in the proportions of the overall generation as well. While onshore and offshore wind turbines made up 13.5% of total generation in the first half of 2015, by 2022 it was 27.2%. The share of PV installations rose from 6.9% to 11.5%. Of course, the amounts of electricity generated each year largely depend on the weather conditions, but the long-term trend is clear.
A comparison of the electricity generated in Germany in the first half of 2022 with the first half of last year shows that nuclear power generation was down 50.7%. This is due to the statutory closures of nuclear plants, the installed generation capacity of which was reduced in the course of the phase-out by 4.1 GW.
There was 7.5% more electricity generated from lignite and 41.8% more from hard coal in the first half of this year than in the same period last year, whereas generation from natural gas was down 13.5% year-on-year.
Overall, electricity generated by conventional power plants was down 6.3%. Renewable generation was up 11.3% year-on-year in the same period.
Less electricity generated from natural gas than in previous years
In the first half of 2022, 25,874 GWh of electricity was produced by natural gas-fired power plants, amounting to 10.1% of total generation. The generation from natural gas was lower than in the first halves of 2020 and 2021.
Besides the competition from renewable and other conventional energy sources, especially coal-fired power stations, there are various aspects to take into consideration here.
Natural gas is used to generate process and district heat and, for technical reasons, electricity is often produced at the same time. From the operators' perspective, it makes sense for combined heat and power (CHP) plants to continue producing electricity if they are responsible for supplying heat to an urban or industrial heating network and if it is not yet possible – or would be more expensive – to separate the heat generation from the electricity generation process. They would therefore need to make their own efforts to replace natural gas for heat production with other energy sources.
Another reason for the use of gas power plants is their flexibility. They can be fired up and down much faster than coal or nuclear plants, which offers advantages if higher demand for electricity needs to be met at short notice, for example. Gas-fired power plants can also be helpful, and in some cases essential, for redispatching and balancing. The great flexibility of gas power plants can be seen in their feed-in time series.
Long-term gas purchasing agreements, in which the gas had to be used in gas-fired power plants or paid for anyway even if it was not taken, also led to economic incentives to use gas in electricity production. Amendments to the Energy Industry Act (EnWG) removed these restrictions on use and now permits the gas to be injected into storage as well.
The pan-European electricity market
Market coupling connects the electricity markets of participating countries, with supply and demand interacting across the whole of Europe. Electricity is produced within Europe wherever it is cheapest. Germany and the other European countries can all benefit from the most favourable conditions for generation in each case. The wholesale electricity prices and trading are the result of this interplay. It is not just the availability of fuel but of power stations as well that plays a role in the conditions for generation. If power plants are not available at short notice – because of a technical fault or maintenance, say – this has an effect on the generating conditions in neighbouring countries, too. Several nuclear plants in France are currently not operational while they undergo maintenance and renovation work. France's overall electricity generation was down 11.2% this half-year.
As a result, Germany exported significantly more electricity to France. Net exports to France were 8,017 GWh in the first half of 2022, more than three times as much as in the same period last year (2,205 GWh). Gas-fired power plants met some of the higher demand for electricity and were viable despite the currently high gas prices.
Net exports to other countries rose in the first half of the year as well. For example, net exports to Belgium climbed from 236 GWh to 957 GWh, to Switzerland from 1,573 GWh to 2,942 GWh and to Czechia from 898 GWh to 1,439 GWh. In the first half of 2021, trading with the Netherlands resulted in net imports to Germany of 691 GWh, but in the first six months of this year Germany exported 655 GWh (net) to the Netherlands.
Total net exports from Germany amounted to 15,759 GWh in the first six months of 2022, up 91.7% year-on-year from 8,222 GWh.
The reasons for the developments in electricity trading with these and other countries are discussed in the quarterly articles under Electricity market topics.