Hint: This website is not optimized for your browser version.
Electricity market topics
The electricity market in 2023
2 January 2024 – Electricity consumption in 2023 was down 5.4% and total generation down 9.1% compared to the previous year. The average wholesale price fell comparatively more to €95.18/MWh. In commercial foreign trade, Germany imported a total of 54.1 TWh and exported 42.4 TWh.
Electricity consumption (grid load) in 2023 was about 5.4% down on 2022, falling for the second successive year.
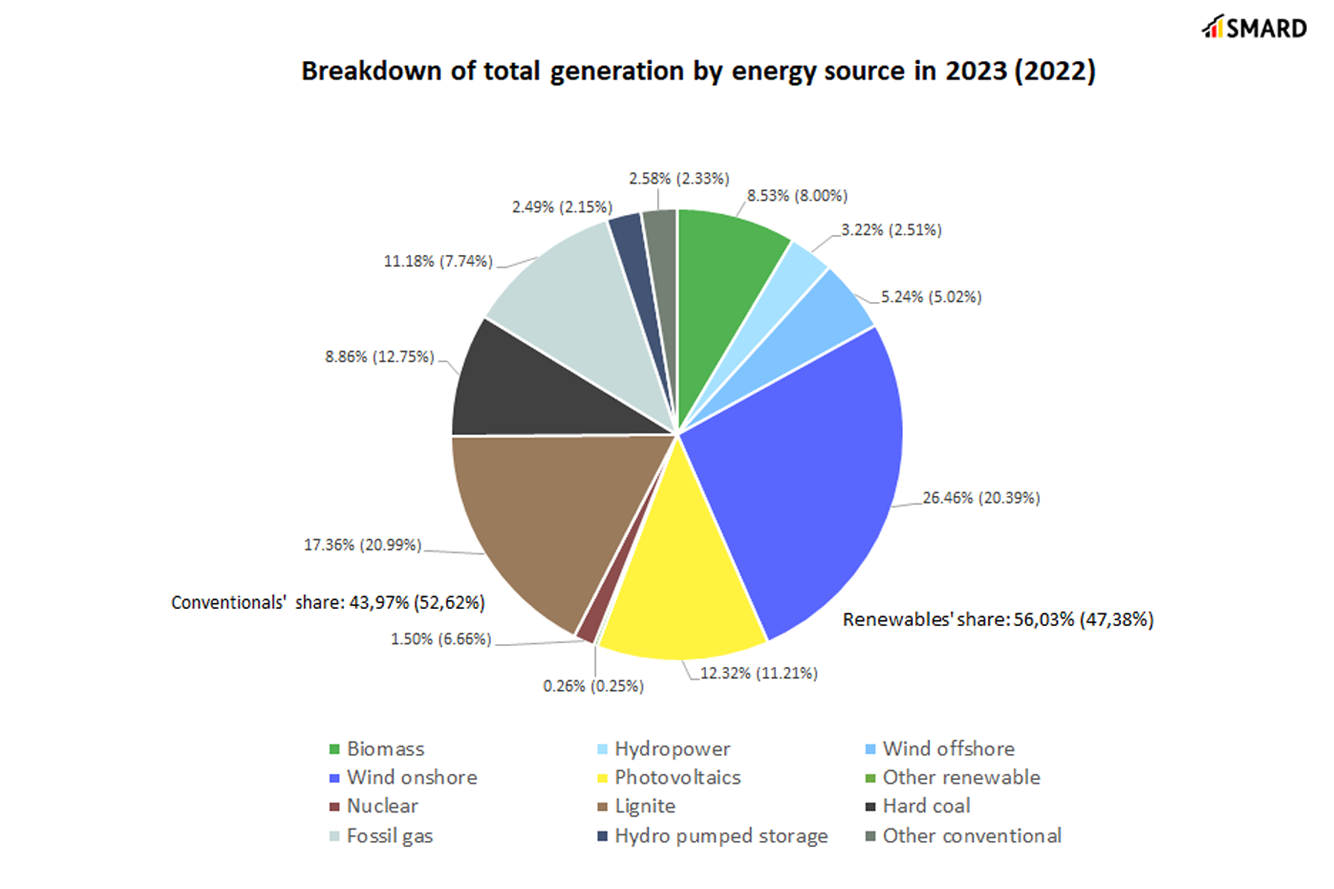
Renewables' share of generation at 56.0%
There was an increase in generation from renewables and especially from onshore wind, up 18.0% on the previous year. Favourable weather conditions and an increase of 2.3 GW in installed capacity resulted in the highest-ever annual generation from renewables of 119.2 TWh.
There was also a large increase of 18.0% in hydropower generation. This was due to comparatively high rainfall levels following the very dry weather in 2022.
By contrast, generation from onshore wind was 5.0% down on the previous year. The main reason for this was the lack of availability of interconnectors and wind farms due to maintenance work.
There were also decreases in generation from biomass (down 3.1%) and other renewables (down 5.1%). Solar generation remained at the previous year's level (down 0.1%). The strong growth in solar capacity in 2023 compensated for the comparatively lower levels of sun following record levels in 2022.
Overall, generation from renewables was 7.5% higher than in 2022. Renewables accounted for 56.0% of the total amount of electricity generated (2022: 47.4%) and covered 55.0%* of electricity consumption (grid load) (2022: 48.4%).
Closure of the last nuclear power plants in April
Conventional generation was down 24.0% compared to the previous year. Generation from hard coal was 36.8% lower and from lignite 24.8% lower. One of the reasons for this was the decrease in the demand for electricity accompanied by the increase in generation from renewable and cheaper energy sources. There were also frequent occasions during the year when coal power stations on the electricity market were unavailable.
The greatest change was, however, in nuclear energy. The SMARD data had already shown a decrease in nuclear generation at the beginning of February. The last nuclear power plants were then taken off the grid on 15 April 2023. The gradual reduction in generation leading up to the plants going offline is clearly visible in the data for that day. There was a downward trend in wholesale electricity prices over the year despite the plants' closure.
Generation using natural gas was higher than in 2022, up 31.3% year-on-year. Gas prices fell following high levels at the end of 2022, which improved the profitability of gas-fired power plants in the electricity market. In the summer of 2023, a partial fuel switch between hard coal and gas took place. With equally high CO2 prices, gas-fired power plants with their high level of efficiency overtook hard coal-fired power plants in the merit order because of their lower marginal costs.
Another reason for the use of gas power plants is their flexibility. They can be switched off and fired up again much faster than coal plants.
Natural gas is also used to generate process and district heat and, for technical and efficiency reasons, electricity is often produced at the same time. From the operators' perspective, it makes sense for combined heat and power (CHP) plants to continue generating electricity if they are responsible for supplying heat to an urban or industrial heating network. This generation is largely independent of the current electricity prices.
Generation from pumped storage in 2023 was up 5.2% and by other conventional sources up 0.7%.
Average wholesale electricity price down to 2021 level
The average wholesale price in 2023 was €95.18/MWh. This was less than half the previous year's average of €235.45/MWh and back to the level in 2021.
There had been a large increase in prices for gas and coal following the Russian invasion of Ukraine in 2022. Electricity prices had been extremely volatile and closely connected to gas price trends. The wholesale prices for electricity started falling again in October 2022. Despite an increase in the average price in January 2023, the downward trend in prices continued from February onwards.
The chart shows that the pattern in wholesale electricity prices is similar to that in the forecast residual load. On the SMARD website, the forecast residual load means the share of electricity consumption (grid load) that is not expected to be covered by wind or solar generation. A low residual load means that a high share of the grid load can be covered by wind and solar generation, and vice versa. The higher the share covered by renewables, the lower the price, thanks to the merit order principle.
German day-ahead wholesale electricity prices | ||
2023 | 2022 | |
Average [€/MWh] | 95.18 | 235.45 |
Minimum [€/MWh] | -500.00 | -19.04 |
Maximum [€/MWh] | 524.27 | 871.00 |
Number of hours with negative prices | 301 | 69 |
The lowest wholesale electricity price in 2023 was recorded between 2pm and 3pm on Sunday 2 July and was negative €500.00. During this hour, generation from renewables alone (49.5 GWh) was higher than electricity consumption (43.6 GWh). Conventional energy sources generated a further 7.2 GWh during this hour and 4.1 GWh of electricity was used to fill pumped storage reservoirs.
There were negative prices in all countries with which electricity is traded except for Poland, Czechia and the northern Italian market area. Hungary, Slovenia, Austria and the Netherlands had the same price as Germany (negative €500/MWh).
The highest price of the year was recorded between 7pm and 8pm on Monday 11 September and was €524.27/MWh. At that time, conventional generation was 34.9 GWh and electricity consumption 57.9 GWh. Denmark had the same price during that hour.
There is an interaction between supply and demand across the whole of Europe. Electricity is produced within Europe wherever it is cheapest. When Germany imports electricity, it benefits from the more favourable conditions for generation in other countries, and vice versa. The respective countries' wholesale prices on the day-ahead market are the result of this interplay.
Commercial foreign trade
In commercial foreign trade**, Germany imported 54.1 TWh of electricity and exported 42.4 TWh.
Flow-based market coupling was extended to more countries in 2022 to make more efficient use of transmission capacity. The flow-based capacity calculation methodology maximises welfare benefits. It was introduced for some country borders in May 2015 and now covers the whole Core Capacity Calculation Region (Core CCR) in central Europe. Further information about the change is provided here (in German).
The coordinated approach is designed to optimise the use of transmission capacity and, as a result, reduce the difference between prices in the individual countries.
An overview of Germany's commercial foreign trade in 2023:
- Belgium:
Exports: 2,969.7 GWh Imports: 2,728.7 GWh - Denmark:
Exports: 2,359.0 GWh Imports: 13,079.5 GWh - France:
Exports: 8,405.8 GWh Imports: 8,821.1 GWh - Netherlands:
Exports: 3,510.3 GWh Imports: 5,651.3 GWh - Norway:
Exports: 1,662.0 GWh Imports: 6,216.9 GWh - Austria:
Exports: 8,484.1 GWh Imports: 2,673.3 GWh - Poland:
Exports: 2,966.1 GWh Imports: 2,447.2 GWh - Sweden
Exports: 369.9 GWh Imports: 3,260.8 GWh - Switzerland:
Exports: 4,919.6 GWh Imports: 5,945.5 GWh - Czechia:
Exports: 3,144.2 GWh Imports: 3,255.8 GWh
_____________________________________________________________________________________________________________
*The grid load share of electricity that was generated from renewables is calculated differently from the federal government’s target definitions for the expansion of renewable energy under the Renewable Energy Sources Act (EEG), where the basis for calculation is gross electricity consumption. The grid load does not include power stations' own consumption or industrial networks, so the calculation basis applied here – compared with the share of gross electricity consumption – typically results in a higher proportion of generation from renewables. The grid load is calculated by taking the net electricity generation, subtracting transmission capacity exports, adding transmission capacity imports and subtracting the pumping work at pumped storage power stations.
**The commercial foreign trade data used in this article that were determined by the results of electricity trading show the planned imports and exports. The imports and exports result from the sum of all volumes of electricity used or nominated in electricity trading from/to adjacent countries in the interconnected system (referred to as exchange schedules).
The figures presented in the charts and in the text may be updated at a later date. Further information about possible updates and data definitions is available (in German) in the user guide.