Hint: This website is not optimized for your browser version.
The electricity market in the first quarter of 2025
Record highs for solar and gas
23.04.2025 – In the first quarter of this year, 0.2% less electricity was consumed than in the first quarter of 2024. Generation decreased by 4.5%. The share of renewables in electricity generation was 49.3% and Germany was a net importer in commercial foreign trade.
A lot of wind at the beginning of the year, a lot of sun later
Electricity consumption (grid load*) in the first quarter of 2025 totalled 124.1 TWh, down 0.2% on the same quarter of 2024 (124.3 TWh).
Electricity generation** fell by 4.5% to 115.7 TWh (Q1 2024: 121.2 TWh). As in the same quarter of the previous year, the largest share of feed-in came from onshore wind (26.8 TWh), though generation fell by 31.2%. While January and February saw phases with high levels of wind generation, these phases subsided in March. Wind generation was overall below the average of the first quarters since 2015. It should be noted that the second highest figures for onshore and offshore wind of all first quarters were recorded in the first quarter of 2024, which is why this year’s decline was even more marked.
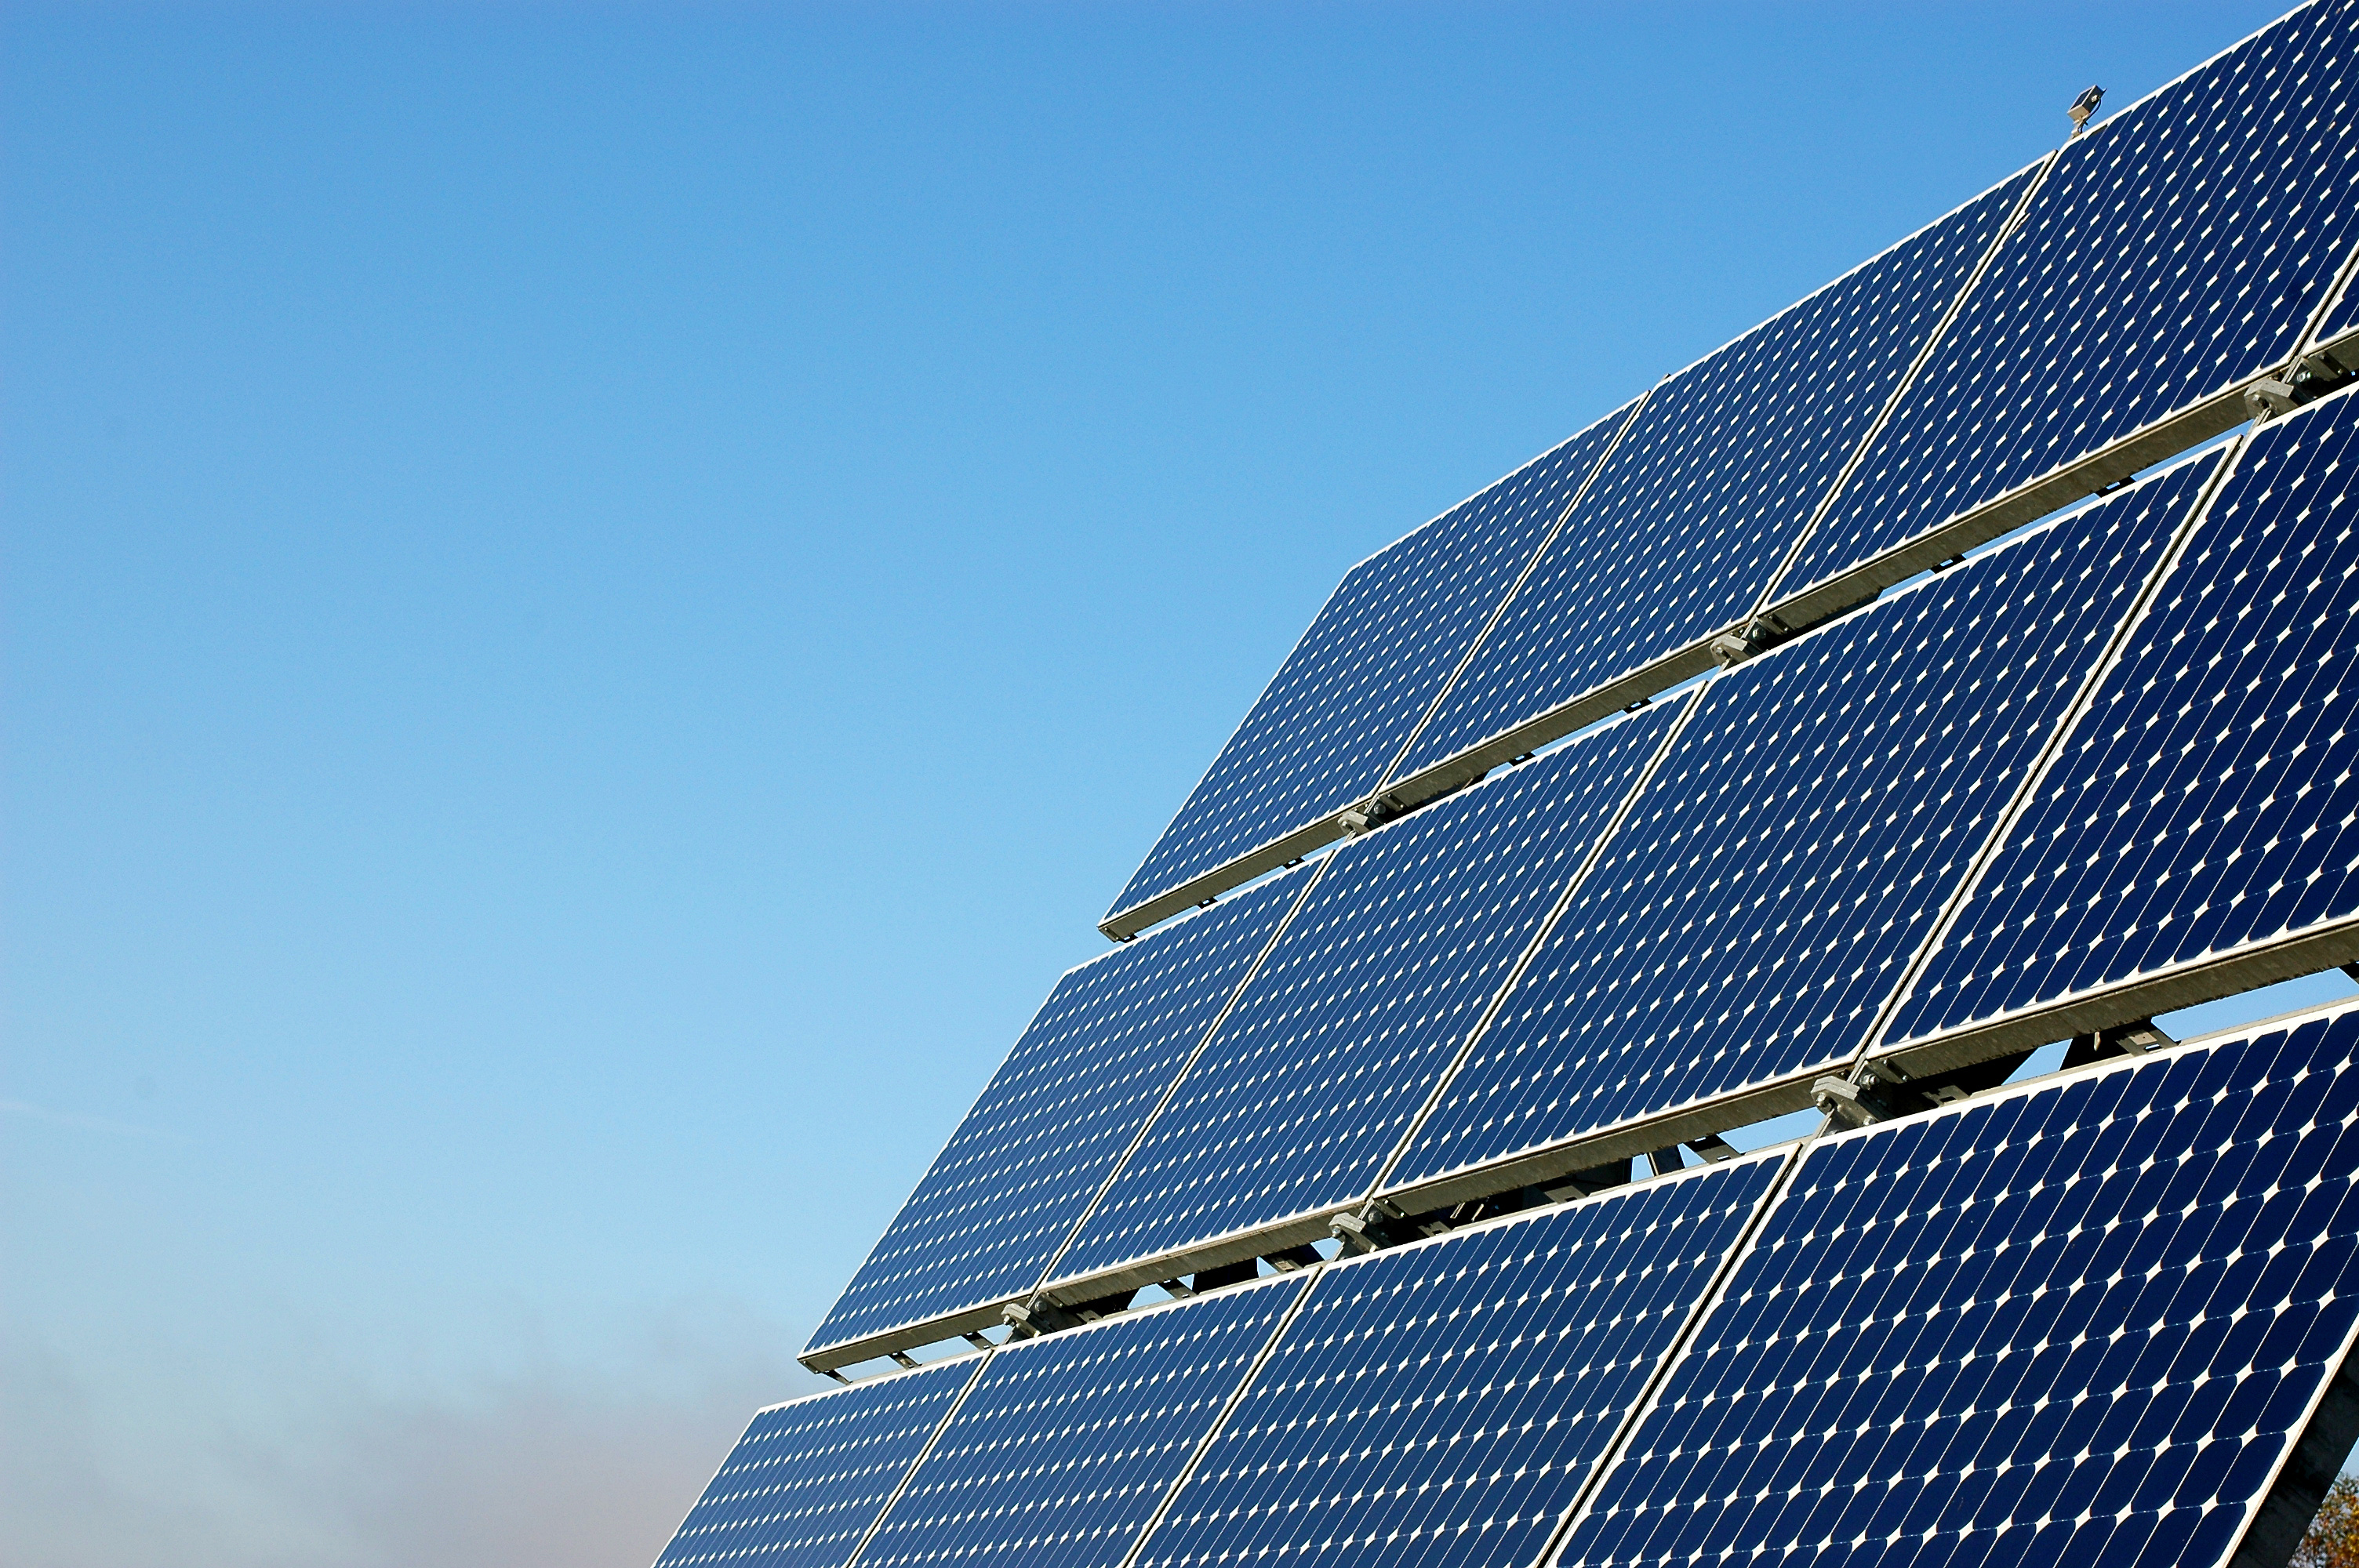
Solar installations, by contrast, saw record feed-in figures in all three months of the quarter. PV feed-in the first quarter (11.2 TWh) was significantly higher than the previous year (8.5 TWh) and the old record of 8.7 TWh from 2022. All three months of the first quarter were exceptionally sunny. In March there were 199 hours of sunshine, a figure that is statistically only achieved in the summer months (DWD). At 86.4 GW, installed generating capacity was also nearly 10 GW higher than it was in the first quarter of 2024 (76.6 GW).
Renewables’ share of total electricity generation in the first quarter was 49.3%, compared with 57.6% in the first quarter of 2024. The significant decline is due in part to the fact that renewables fed an above-average amount of electricity into the grid in the first quarter of 2024. Weather conditions (DWD) resulted in feed-in levels from wind and solar energy that were only rarely high at the same time in the first quarter of 2025, which kept overall feed-in from renewables comparatively low throughout the quarter. Here the high PV feed-in could not make up for the low wind feed-in. There were also phases in which both wind and solar power generated only small amounts of electricity. Of the individual renewable energy sources, only solar generation increased compared to the same quarter of the previous year, and only solar power and offshore wind reached levels above the average since 2015.
As regards conventional energy sources, feed-in from natural gas increased by 19.8% and reached a quarterly record high of 21.3 TWh. Lignite (21.2 TWh, up 9.9%) and hard coal (11.0 TWh, up 21.7%) also increased compared with the same quarter of last year, but over the longer term dropped significantly compared with the first quarter of 2023 (lignite: 23.3 TWh; hard coal: 16.1 TWh). Since wholesale prices for gas have risen by around 23% compared with the first quarter of 2024 (Bundesnetzagentur), the high feed-in from natural gas cannot be explained by price effects. Clearly the lower feed-in from wind power compared with the same quarter of the previous year had to be compensated by conventional energy sources.
Higher wholesale prices throughout the internal market
The average wholesale electricity price on the day-ahead market (€111.94/MWh) was 65.4% higher than in the first quarter of 2024 (€67.67/MWh). In 44 of 2,159 hours this resulted in negative wholesale prices, while in the same quarter of the previous year it was the case in 32 of 2,183 hours (the first quarter of 2024 was 24 hours longer because it was a leap year). Due to the fact that there was less feed-in from renewable energy sources than in the first quarter of 2024, the more expensive conventional power plants were used more frequently in the merit order, which is reflected in the average wholesale price.
In the neighbouring countries, the average wholesale electricity price of €104.50/MWh was also significantly higher than in the first quarter of 2024 (€68.51/MWh). The biggest price increases were in Hungary (€135.28/MWh, up 84.1%) and Slovenia (€128.19/MWh, up 79.2%), while Sweden (€70.46/MWh, up 17.1%) and Norway (€66.51/MWh, up 3.0%) saw only comparatively small price increases.
Particularly high wholesale prices (above €300/MWh) were paid in 15 hours during the first quarter. Such price peaks did not occur in the first quarter of 2024. In addition to the higher share of conventional energy sources in the energy mix, these price peaks also affected the average wholesale price. The highest day-ahead wholesale price of €583.40/MWh was recorded between 5pm and 6pm on 20 January 2025. This was one of the above-mentioned phases with very low wind and solar generation. The residual load, which is the difference between grid load and generation from the low-cost energy sources wind, water and sun, was 66.0 GWh during this hour, one of the quarter’s highest figures. As a result, a lot of electricity had to be generated by conventional energy sources or imported. During that hour the average wholesale price in the neighbouring countries was €436.00/MWh. Around 11.1 GWh of electricity were imported on a market-driven basis, ie it was cheaper to procure it on the European internal market than to generate it in Germany.
The Bundesnetzagentur has published an assessment of the occasionally high wholesale prices here (in German).
Day-ahead wholesale electricity prices in Germany | ||
Q1 2025 | Q1 2024 | |
Average [€/MWh] | 111.94 | 67.67 |
Minimum [€/MWh] | -26.07 | -9.98 |
Maximum [€/MWh] | 583.40 | 174.70 |
Number of hours with negative prices | 44 | 32 |
Number of hours with prices above €300/MWh | 15 | 0 |
More electricity imports, but also more exports
Germany’s electricity imports in the first quarter of 2025 totalled 16.1 TWh, which marks a 26.1% increase over the first quarter of 2024 (12.8 TWh). The largest share of imports was from France (3.7 TWh), followed by Denmark (3.6 TWh) and the Czech Republic (2.6 TWh). Imports from France and Denmark increased compared to the first quarter of 2024, while imports from the Czech Republic decreased.
Exports amounted to 11.1 TWh, a slight increase from 11.0 TWh in the first quarter of 2024. The largest amounts of electricity were exported to Switzerland (3.9 TWh), Denmark (2.5 TWh) and Poland (1.3 TWh). Exports to Norway fell sharply. While 0.5 TWh were exported to Norway in the first quarter of 2024, that figure dropped to less than 0.1 TWh in the first quarter of 2025.
An overview of Germany’s commercial foreign trade in electricity in the first quarter of 2025:
- Belgium:
Exports: 709.7 GWh, Imports: 978.6 GWh - Denmark 1:
Exports: 648.2 GWh, Imports: 2,922.0 GWh - Denmark 2:
Exports: 706.8 GWh, Imports: 1,888.8 GWh - France:
Exports: 164.5 GWh, Imports: 3,681.5 GWh - Netherlands:
Exports: 134.1 GWh, Imports: 1,054.0 GWh - Norway:
Exports: 88.4 GWh, Imports: 2,113.4 GWh - Austria:
Exports: 1,004.2 GWh, Imports: 641.8 GWh - Poland:
Exports: 1,316.0 GWh, Imports: 457.1 GWh - Sweden:
Exports: 58.5 GWh, Imports: 861.5 GWh - Switzerland:
Exports: 3,913.1 GWh, Imports: 107.0 GWh - Czech Republic:
Exports: 1,193.3 GWh, Imports: 2,593.2 GWh
_________________________________________________________
*The grid load share of electricity that was generated from renewables is calculated differently from the federal government’s target definitions for the expansion of renewable energy under the Renewable Energy Sources Act (EEG), where the basis for calculation is gross electricity consumption. The grid load does not include power stations’ own consumption or industrial networks, so the calculation basis applied here – compared with the share of gross electricity consumption – typically results in a higher proportion of generation from renewables. The grid load is calculated by taking the net electricity generation, subtracting transmission capacity exports, adding transmission capacity imports and subtracting the pumping work at pumped storage power stations.
**The actual generation is the net electricity generation. It is the electricity fed into the general supply network less the electricity consumed by power plants themselves. It does not include electricity generated in the Deutsche Bahn network or within industrial networks and closed distribution networks.
***The energy mix of imports from Switzerland is not currently being transmitted. These imports are therefore currently being classed as “unknown” so as not to distort the overall breakdown. The Bundesnetzagentur strives to publish information showing imports by energy source as quickly as possible. Further information about how the energy mix of electricity imports and exports is calculated is available here.
The figures presented in the charts and in the text may be updated at a later date. Further information about possible updates and data definitions is available (in German) in the user guide.