Hint: This website is not optimized for your browser version.
The electricity market in the fourth quarter of 2025
Records for solar and wind offshore
09 February 2026 – Electricity generation in Germany in the fourth quarter of 2025 was 117.3 TWh, 3.2% higher than in the same quarter of 2024, while consumption was 124.3 TWh and 2.4% higher. The average day-ahead wholesale electricity price was €93.15/MWh, 9.2% lower than a year earlier. Germany was a net importer in commercial foreign trade.
Renewables accounted for 55.4% or 65.0 TWh of actual generation*, compared with 52.0% and 59.0 TWh in the fourth quarter of 2024.
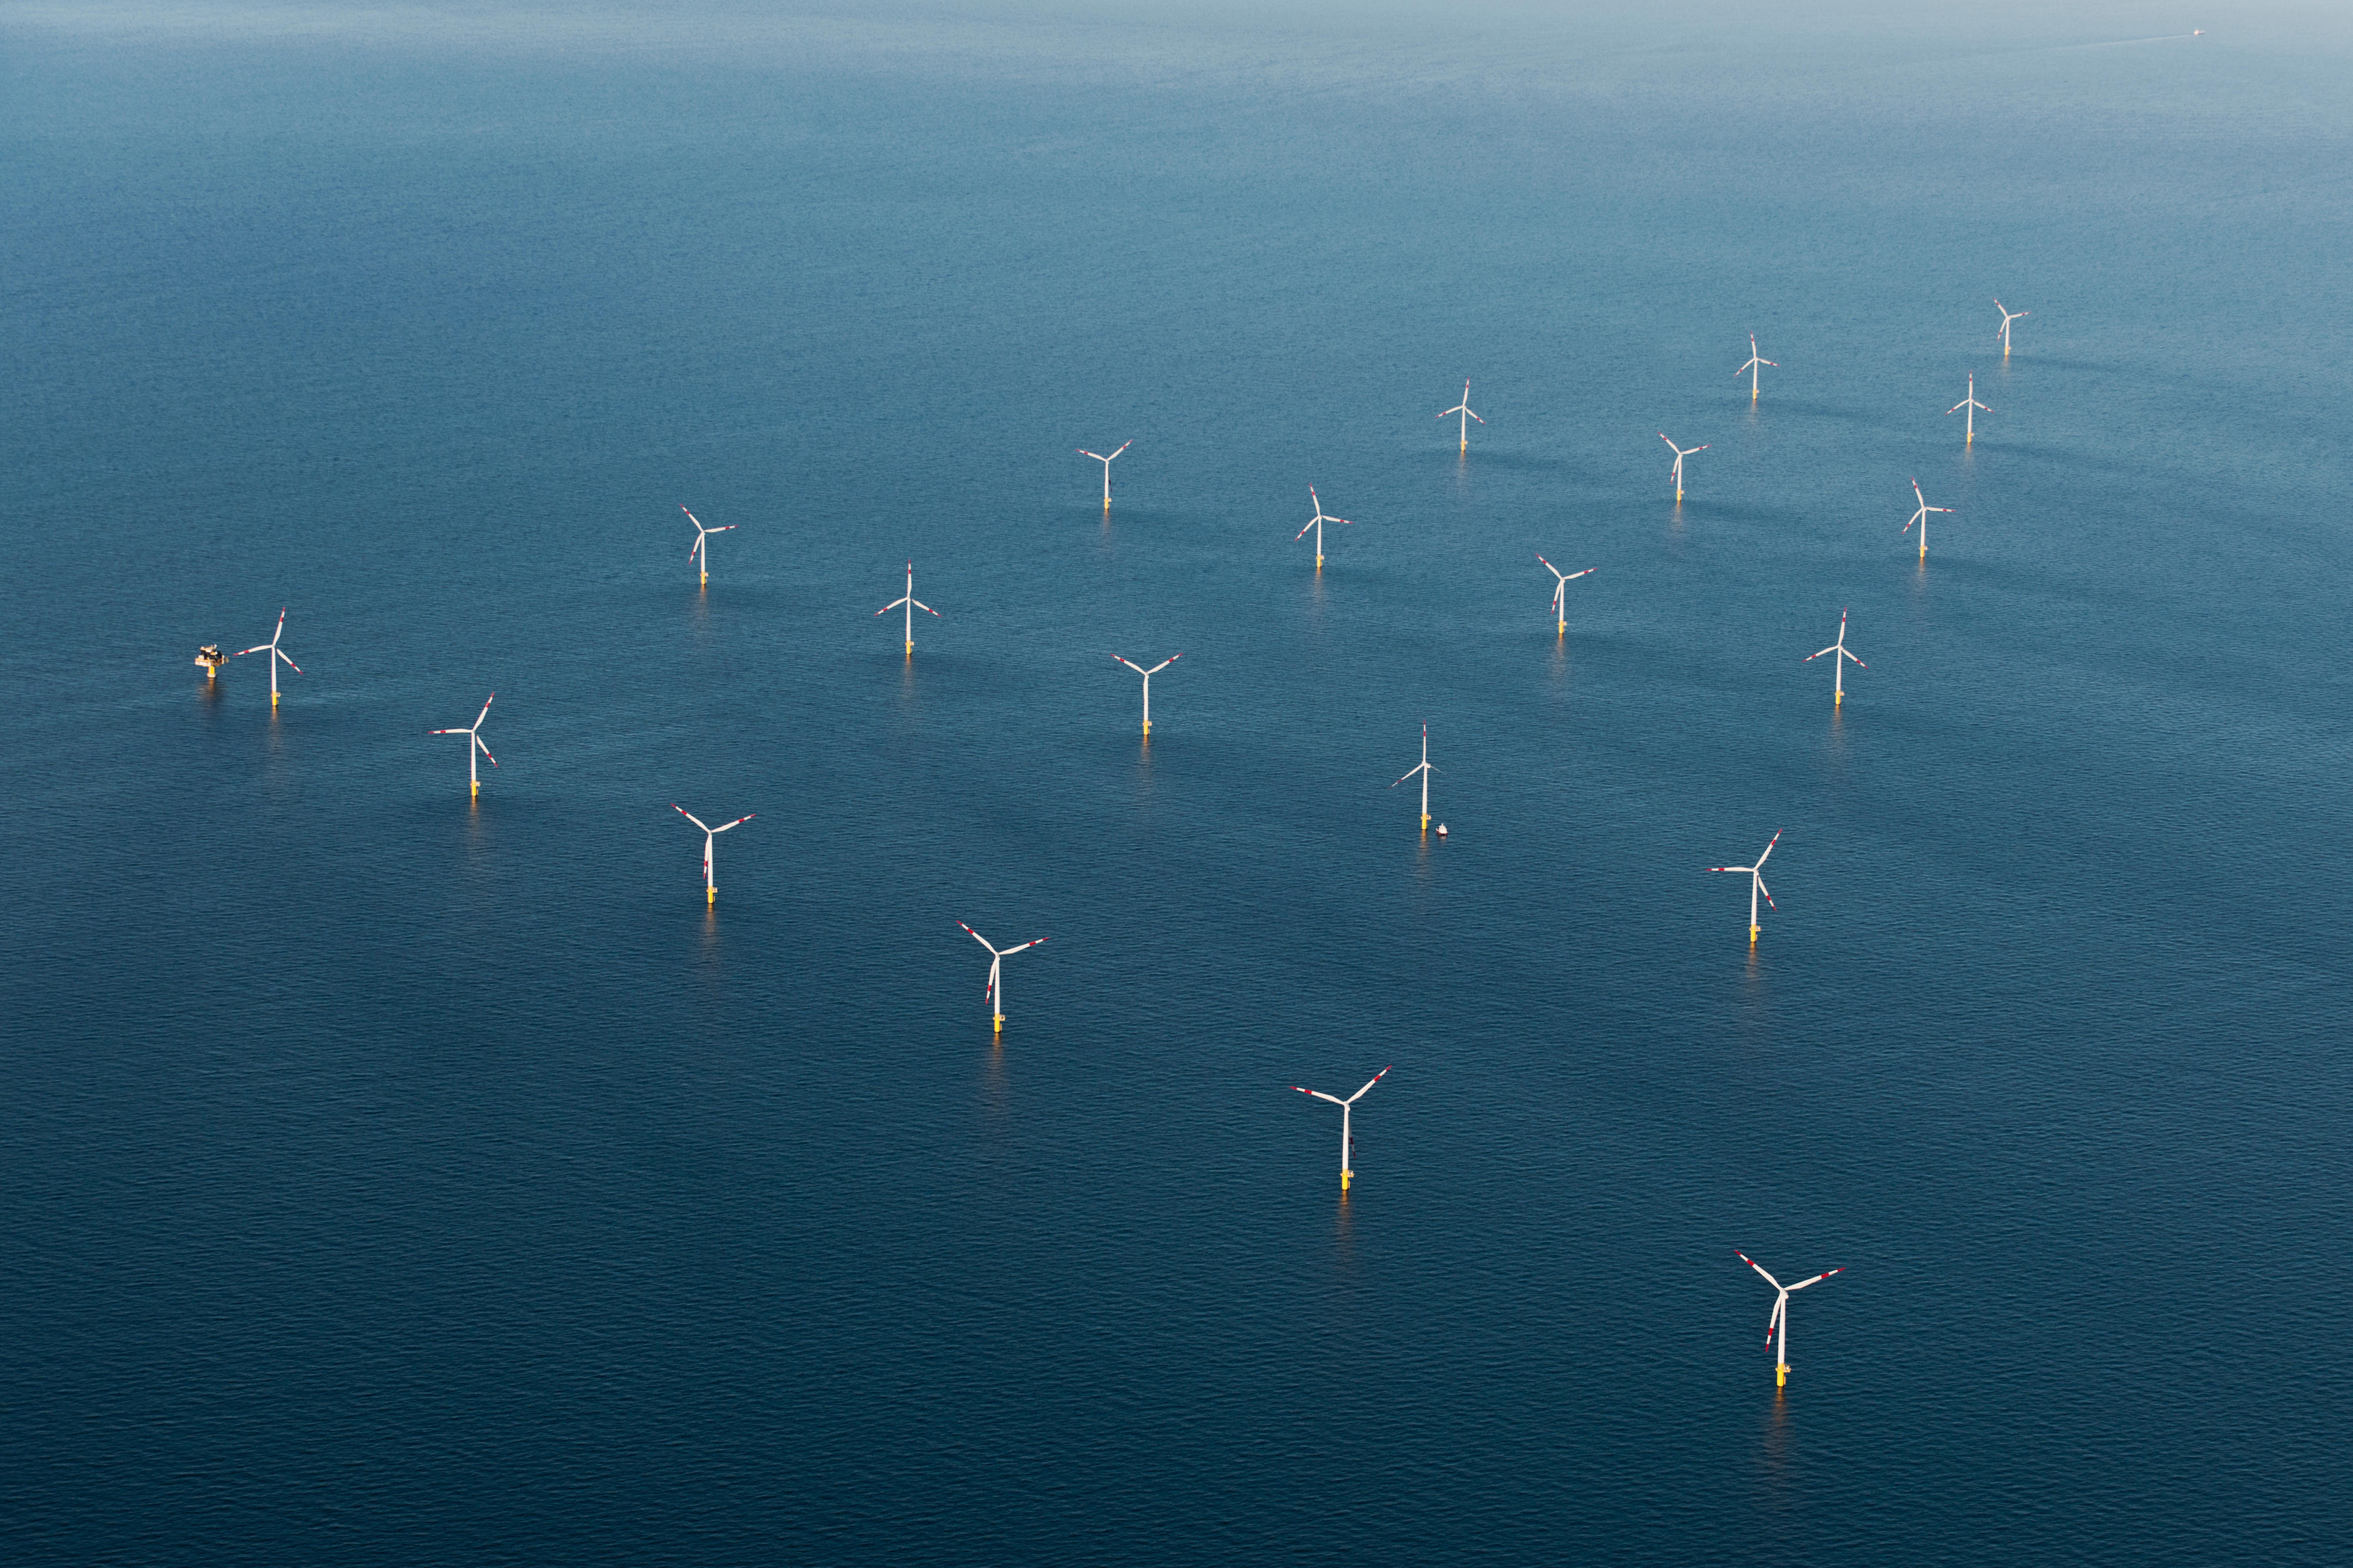
More wind and solar generation
Onshore wind had the largest share among all energy sources in net electricity generation (30.6%), as in Q4 2024 (28.4%). Offshore wind saw the largest increase in generation (up 28.5%), followed by solar (up 24.5%). As a result, these two energy sources recorded their highest generation levels for a fourth quarter, with 8.9 TWh for offshore wind and 7.6 TWh for solar**. The only month of the quarter in which onshore wind generated more than in Q4 2024 was October, leading to a comparatively moderate increase in onshore wind generation of 10.8%.
The large increase in solar generation is due to both the continued growth in generation capacity and the unusually high number of sun hours in November and December (DWD, in German). Although growth in offshore wind capacity was much smaller by comparison, the fact that far fewer curtailments were made contributed to the increase of nearly 2 TWh in offshore wind generation compared with Q4 2024.
Lignite now behind natural gas
In Q4 2024 lignite had the second largest share among all energy sources in net electricity generation (18.8%) and was ahead of natural gas (15.5%). The opposite was the case in Q4 2025. Lignite fed in 17.2% less electricity and natural gas 15.6% more than in Q4 2024. As a result, natural gas increased its share to 17.3% of total generation while lignite’s share fell to 15.1%. Lower gas prices and higher carbon prices mean electricity generation using natural gas makes more financial sense than generation with lignite or hard coal, which produces more carbon emissions.
Electricity consumption (grid load***) in Q4 2025 totalled 124.3 TWh, up about 2.4% on Q4 2024 (121.4 TWh). The increase in solar and wind generation led to a decrease of 5.4% in the residual load to 71.8 TWh. The residual load is the grid load not covered by wind or solar generation.
It is interesting to note that renewable generation covered the total grid load more than two and a half times more often in Q4 2025 than in Q4 2024. In Q4 2025 this happened in a total of 409 quarter hours, compared with 160 in Q4 2024. This typically leads to low wholesale prices and consequently higher exports because it is more often financially better for electricity suppliers to buy their electricity from Germany than in their own countries, where it is more expensive. These situations sometimes lead to negative prices as well.
Most of the quarter hours in which renewables covered the grid load were at the beginning and end of October. The first weekend in October, a long weekend with a public holiday on the Friday, saw high levels of first solar and then wind generation. During the last weekend in the month from 24 to 26 October high levels of wind feed-in contributed to a high level of generation by renewables overall. The fourth quarter of 2023 had the highest ever number of quarter hours for a fourth quarter in which renewables covered the grid load (642). This quarter also had the highest ever level of renewable generation for a fourth quarter (69.3 TWh) as well as the highest level of onshore wind generation for any quarter (42.3 TWh).
Wholesale electricity prices down by about 9%
The average day-ahead wholesale electricity price in Q4 2025 was €93.15/MWh, representing a large decrease of 9.2% compared with Q4 2024. Prices in Germany’s neighbouring countries also fell, although not as much, down 4.1% to €89.33/MWh.
France’s average wholesale price in Q4 2025 was considerably lower than in Q4 2024, with a decrease of 28.8% from €86.76/MWh to €61.80/MWh. The market areas with the largest price increases were Norway 2 (up 30.3%) and Sweden 4 (up 24.3%). However, wholesale prices in those two market areas in Q4 2024 were by far the lowest and in Q4 2025 were still the lowest in any of the neighbouring countries except for France.
Average wholesale prices in Germany and neighbouring countries | |||
Q4 2025 (€/MWh) | Q4 2024 (€/MWh) | Change (%) | |
Germany/Luxembourg | 93.15 | 102.64 | -9.2 |
Average in neighbouring countries | 89.33 | 93.17 | -4.1 |
Belgium | 82.16 | 97.22 | -15.5 |
Denmark 1 | 84.42 | 88.07 | -4.1 |
Denmark 2 | 85.89 | 88.03 | -2.4 |
France | 61.80 | 86.76 | -28.8 |
Netherlands | 87.86 | 102.91 | -14.6 |
Norway 2 | 69.68 | 53.48 | 30.3 |
Austria | 112.96 | 115.17 | -1.9 |
Poland | 115.06 | 111.01 | 3.6 |
Sweden 4 | 65.83 | 52.98 | 24.3 |
Switzerland | 112.34 | 111.26 | 1.0 |
Czechia | 104.65 | 118.00 | -11.3 |
The highest wholesale price in Q4 2025 was recorded on 14 October. One megawatt hour cost €407.21 between 7pm and 8pm on that day. The highest day-ahead wholesale price in Q4 2024 had been €936.28/MWh. The Bundesnetzagentur and the Bundeskartellamt investigated this extreme price and other price peaks in winter 2024 for indications of abusive market practices. However, no evidence of abusive behaviour was found.
Q4 2024 saw several “dunkelflaute” periods, when there was very little wind or solar power. This had an effect on the wholesale prices, which reached above-average levels in large parts of the European internal electricity market. There were hardly any dunkelflaute phases like these in Q4 2025, which was a key factor in the overall low level of wholesale prices.
There were fewer particularly high prices in Q4 2025 than in Q4 2024. In Q4 2025 prices above €300/MWh were recorded in 13 out of 2,208 hours and prices above €100/MWh in 725 hours, compared with 35 and 1,051 hours respectively in Q4 2024. By contrast, negative wholesale prices occurred more often in Q4 2025 (48 hours) than in Q4 2024 (44 hours).
Day-ahead wholesale electricity prices in Germany | ||
Q4 2025 | Q4 2024 | |
Average [€/MWh] | 93.15 | 102.64 |
Minimum [€/MWh] | -4.98 | -15.69 |
Maximum [€/MWh] | 407.21 | 936.28 |
Number of hours with negative prices | 48 | 44 |
Number of hours with prices above €100/MWh | 725 | 1,051 |
Number of hours with prices above €300/MWh | 13 | 35 |
Slightly higher imports and considerably higher exports
Germany exported a total of 15.7 TWh of electricity in Q4 2025, 18.6% more than in Q4 2024. The higher level of generation by renewables overall contributed to this increase. Imports rose by 4.5% to 19.8 TWh, bringing net imports down by 28.7% to 4.0 TWh. While imports in November and December by far exceeded exports, net imports in October were only about 0.1 TWh.
Onshore wind had the largest share in total exports among all energy sources. Although onshore wind’s share in exports hardly changed, the amount of exported electricity generated by this energy source increased by about 0.8 TWh to 4.7 TWh. Offshore wind recorded an increase in both its share in exports and the amount of electricity exported. This amount rose from 0.7 TWh in Q4 2024 to 1.1 TWh in Q4 2025. A total of 8.0 TWh or 60.4% of all the electricity exported in Q4 2025 came from renewables, compared to 6.3 TWh and 57.8% in Q4 2024.
Offshore wind also saw an increase in both its share in imports and the amount of electricity imported, from 9.8% and 1.6 TWh in Q4 2024 to 12.6% and 2.2 TWh in Q4 2025. Nuclear energy had the largest share in the energy mix of electricity imports in Q4 2025, as in Q4 2024; while there was a small increase in the amount of electricity from nuclear imported from 3.8 TWh to 3.9 TWh, there was a slight decrease in its share of imports from 22.8% to 22.3%.
Germany exported the largest amount of electricity to Austria, as in Q4 2024. Exports to the country amounted to 4.8 TWh, representing a large increase of 55.8%. The only countries for which exports increased even more were Switzerland (up 62.1%) and Denmark (up 69.8%). There was a huge decrease in electricity exports to France (down 82.1%). As France’s average wholesale prices fell more than in the other neighbouring countries, imports from Germany did not make financial sense so often for French electricity suppliers.
The largest amounts of electricity imported into Germany were from Denmark (5.6 TWh), France (4.3 TWh) and the Netherlands (3.7 TWh). The three largest amounts of imports in Q4 2024 came from the same countries in the same order, but the changes in the amounts differed between the countries. While there was only a slight increase of 9.9% in imports from Denmark, imports from France rose by 38.5% and from the Netherlands by 68.8%. The largest decreases were in imports from Austria (down 77.1%) and Poland (down 79.9%). Germany recorded net imports of 0.9 TWh from Switzerland in Q4 2024 but net exports of 0.9 TWh in Q4 2025.
Overview of commercial foreign trade (rounded figures)****:
Imports (TWh) | Exports (TWh) | |
Total | 19.7 | 15.7 |
Belgium | 1.9 | 0.7 |
Denmark | 5.6 | 1.6 |
France | 4.3 | 0.2 |
Luxembourg | 0.0 | 1.0 |
Netherlands | 3.7 | 1.2 |
Norway | 2.5 | 0.2 |
Austria | 0.1 | 4.8 |
Poland | 0.2 | 1.9 |
Sweden | 0.4 | 0.1 |
Switzerland | 0.8 | 1.7 |
Czechia | 0.4 | 2.4 |
_____________________________________________
*The actual generation is the net electricity generation. It is the electricity fed into the general supply network less the electricity consumed by power plants themselves. It does not include electricity generated in the Deutsche Bahn network or within industrial networks and closed distribution networks.
**Electricity that is generated by private household solar installations and used by the households themselves is not included in the figure for actual generation. Only the electricity that these installations generate and feed into the general supply network is included.
***The grid load share of electricity that was generated from renewables is calculated differently from the federal government’s target definitions for the expansion of renewable energy under the Renewable Energy Sources Act (EEG), where the basis for calculation is gross electricity consumption. The grid load does not include power stations’ own consumption or industrial networks, so the calculation basis applied here – compared with the share of gross electricity consumption – typically results in a higher proportion of generation from renewables. The grid load is calculated by taking the net electricity generation, subtracting transmission capacity exports, adding transmission capacity imports and subtracting the pumping work at pumped storage power stations.
****As the methods for calculating the energy mix of electricity imports and exports differ slightly from the methods for calculating total imports and exports, the sum of the individual energy mix figures for a country may differ from the totals given here.