Hint: This website is not optimized for your browser version.
Congestion management in Q4 2025 and the full year 2025
Volume of measures stable in the year as a whole
30.03.2026 - In the fourth quarter of 2025, the volume of measures was about 9% lower than in the same quarter of the previous year and costs were down about 18%. The volume of congestion management measures for the year 2025 as a whole, meanwhile, was nearly the same as in 2024, while costs were up almost 4%.
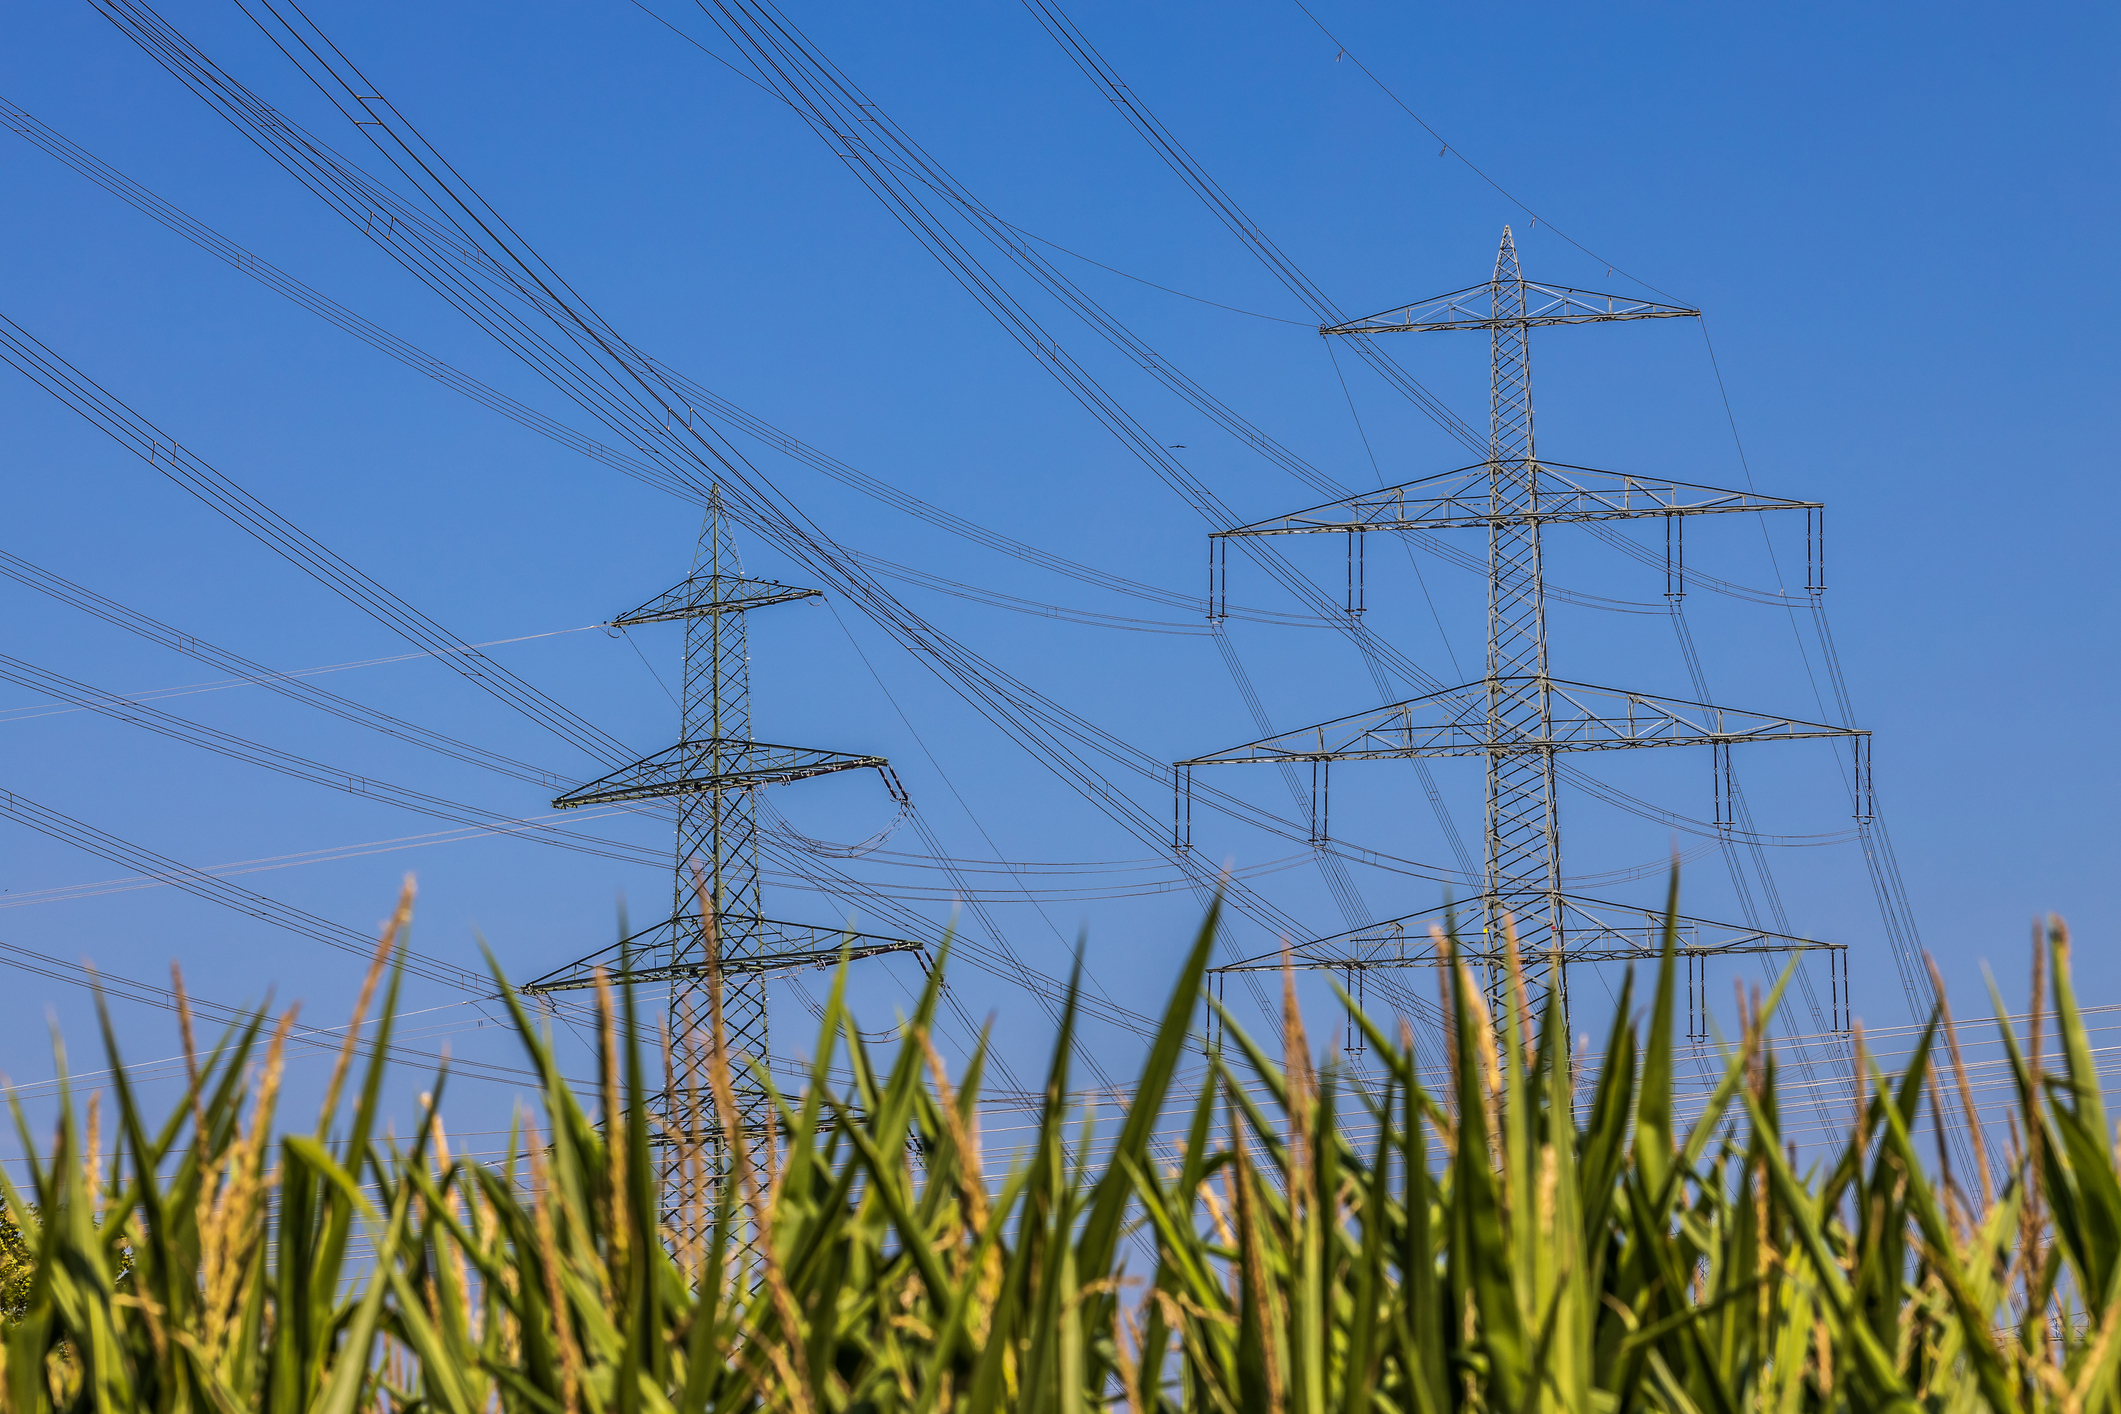
The constant growth of renewable energy in regions where demand is low poses increasing challenges for the electricity grid. As it often takes a long time to plan and implement the expansion of the grid, any discrepancies arising from electricity being generated far away from its place of consumption can only be balanced out after a delay. Consequently, there are strong power flows between the main areas of generation and consumption that place a heavy strain on existing transmission capacity and can lead to regional network congestion.
Intensive efforts are being put into expanding the grid to avoid such congestion but, until new lines are operational, temporary measures are needed to ensure system stability. Congestion management plays a key role in this process by reducing the amount of electricity fed in by installations in areas with limited network capacity while activating additional generation in regions that are under less strain.
There is an increasing focus on distribution networks as well as the transmission network. The strong growth in distributed renewable energy installations is causing greater congestion in the lower network levels.
In Q4 2025, the volume of measures fell by around 9%. Costs were down around 18%.
The total volume of measures taken for congestion management (redispatching with operational and grid reserve power plants and countertrading) dropped by about 9% from 10,427 GWh in the fourth quarter of 2024 to 9,531 GWh in the same quarter of 2025.
The volume of measures in which the feed-in of generating installations was reduced was 4,554 GWh in Q4 2025 (Q4 2024: 4,880 GWh). While the reduction of conventional power plants was almost 6% higher at 2,002 GWh in Q4 2025 (Q4 2024: 1,892 GWh), negative redispatching of renewable power plants was down from 2,988 GWh in the fourth quarter of 2024 to 2,552 GWh in the last quarter of 2025. This development was mainly caused by the significant drop in redispatching measures for offshore wind turbines (Q4 2025: 1,166 GWh; Q4 2024: 1,812 GWh). The reduced curtailments of offshore wind plants compared to the same quarter of the previous year were primarily due to the unusually high need for redispatch in Q4 2024 caused by an extremely windy December in that year.
In the redispatching of renewable energy installations, 71% was a consequence of congestion in the transmission system and 29% due to congestion in the distribution system. This ratio was 83% to 17% in Q4 2024.
Approximately 4% of all renewable electricity generation was curtailed, which means that around 96% of the renewable energy produced was fed into the grid and used by final customers.
Conventional operational power plants were ramped up to balance out the reductions to the tune of 2,653 GWh, which was about 15% less than in the fourth quarter of 2024 (3,042 GWh). The volume of measures using reserve power plants was 532 GWh, which was also well below the 796 GWh of the fourth quarter of 2024. This development was due to the decline in negative redispatching, which made fewer compensatory measures and increases in feed-in by power plants necessary.
Congestion management costs totalled about €885mn in the fourth quarter, which was about 18% lower than in the same quarter of the year before, in line with the lower volume (Q4 2024: €1,077mn).
The volume of congestion management measures was nearly unchanged year-on-year in 2025 as a whole.
The total volume of congestion management measures remained almost the same at 30,319 GWh in 2025 from 30,318 GWh in 2024.
Over 96% of renewable electricity generated was successfully transported to final customers in 2025.
The volume of redispatching measures in which the feed-in of generating installations was reduced was 15,549 GWh in 2025, a year-on-year rise of about 7% (2024: 14,469 GWh).
Of this, 60% or 9,379 GWh were redispatching measures for renewable energy installations. This volume was largely stable from the previous year (2024: 9,389 GWh), although there were changes in the proportions of renewable energies that were curtailed.
- The volume of redispatching measures affecting offshore wind turbines was 3,351 GWh in 2025, a year-on-year fall of about 27% (2024: 4,565 GWh).
- The curtailment of onshore wind installations was slightly lower than in 2024 at 3,225 GWh from 3,394 GWh.
- The redispatching volume affecting solar PV installations was 2,704 GWh and thus around 94% higher than in the previous year (2024: 1,394 GWh).
The main reasons for the development in solar redispatching were the large increase in generating capacity, amounting to almost 10 GW, and the unusually sunny spring and summer. The decline in the curtailment of offshore wind installations was partly caused by the strong solar output, especially in the summer months, leading to greater east-west flows that are little affected by offshore wind farms. In addition, it should be remembered that the fourth quarter of 2024 was an outlier as it included a very windy December with an unusually high need for redispatching.
Although 59% of the volume of reductions involved renewable energy installations connected to the distribution network, around 65% of the redispatching volume with renewables was due to congestion in the transmission network (2024: 74%). A shift can be noticed, however, with the volume due to congestion in the distribution network increasing to about 35% (2024: 26%). This article provides further background information on the shift in the cause of congestion.
Overall, renewable energy curtailments amounted to 3.5% of the total amount of electricity generated by renewables. This means that over 96% of the renewable energy produced was fed into the grid and used by end customers.
The volume of negative redispatching measures involving conventional power plants was 6,170 GWh in 2025, a year-on-year rise of 21% (2024: 5,088 GWh). The most affected energy sources were lignite (1,403 GWh compared to 1,249 GWh in 2024), natural gas (977 GWh from 537 GWh in 2024) and hard coal (661 GWh from 421 GWh in 2024).
To balance out the reductions, feed-in from operational power plants was increased by a total of 7,732 GWh. This corresponds to a decrease of around 7% from 8,315 GWh in 2024.
In addition, 1,302 GWh of electricity from reserve power plants was used to relieve congestion in 2025, a decline of about 3% from the previous year’s figure of 1,336 GWh. Another 523 GWh came from firing up reserve power plants for test starts and test runs (2024: 452 GWh).
The fact that the volume of positive redispatching went down in 2025 although reductions in the same time period were up is linked to the fact that reductions in the distribution system were much higher. As the distribution system operators do not balance these themselves, the balance responsible parties carry out the balancing and the relevant volumes are not included in the increases shown here.
Feed-in from natural gas (4,143 GWh) and hard coal-fired (3,144 GWh) power plants was most frequently increased, with lignite in third place with 851 GWh.
The volume of the countertrading measures taken fell by about 9% from 5,739 GWh in 2024 to around 5,211 GWh in 2025. The decline was partly caused by the strong solar output in the summer months shifting the congestion situation increasingly to east-west flows. Countertrading measures have no effect on these shifted flows, so the need went down, especially in the summer. It should also be noted that the tense congestion situation in Q4 2024 caused an unusually high need for measures and was thus an outlier.
Congestion management costs rose about 4%.
The total costs for congestion management measures in 2025 were provisionally put at around €3,071mn (2024: €2,954mn), corresponding to a rise of around 4%. These costs are made up as follows:
*As from 2023 the provisional costs of reserving the grid reserve plant capacity plus costs not dependent on the use of the reserve include the costs of deploying the capacity reserve and the costs of contracting and deploying special grid facilities in addition to the costs for the grid reserve.
The provisional costs for redispatching measures using conventional power plants in 2025 were €1,176mn, representing a decrease of about 5% compared with 2024 (€1,233mn). This is due firstly to the fall in fuel prices and secondly to the decrease in the volume of positive redispatching measures using conventional operational power plants compared with 2024.
The financial compensation paid to operators of curtailed renewable energy installations was down by about 22% year-on-year to around €433mn (2024: €554mn). That the financial compensation was lower although the volume of redispatching of renewables remained stable is basically down to the higher wholesale prices, which led to a smaller market premium (2024: av €78.51/MWh; 2025: av €89.32/MWh).
When feed-in from direct-selling renewable energy installations is reduced, plant operators are treated economically as if the intervention measure had not taken place. The network operator credits the reduced volume of electricity to the balancing group of the installation operators and/or their direct sellers. This enables the plant operator to actually complete its commercial transaction and receive the same market revenue as agreed with the direct seller. The plant operator also receives the “market premium” from the network operator as the financial support for direct selling is referred to under the Renewable Energy Sources Act (EEG). The market premium is the difference between a certain set price of the installation (equal to the renewable energy installation’s primary revenue need) and the monthly or annual average price for electricity on the exchange.
In 2025 the provisional costs of reserving the grid reserve plant capacity plus costs not dependent on the use of the reserve totalled €952mn (2024: €696mn). The costs of deploying the grid reserve amounted to about €407mn (2024: €372mn). The total costs for the grid reserve in 2025 were therefore around €1,359mn.
The costs of reserving the capacity were higher because an additional power plant was added to the grid reserve, fuel was stockpiled and several power stations already in the grid reserve were upgraded.
The costs for countertrading measures in 2025 were about €102mn, corresponding to an increase of about 4% on the year before (2024: €98mn). The rise in costs despite the decrease in volume is due to the wholesale prices, which were higher than in the previous year.