Hint: This website is not optimized for your browser version.
High proportion of renewable energy in electricity consumption - Electricity generation and electricity trading in April 2020
14 May 2020 - Compared with the same month of the previous year, electricity generation and electricity consumption in Germany were down 16.8% and 8.3% respectively. The average wholesale price was €17.09/MWh, which was lower than the average price a year earlier. Germany imported 596.4 GWh more electricity than it exported, making it an overall net importer.
Electricity generation from renewable and conventional energy sources totalled 34.7 TWh in April (2019: 41.8 TWh). Generation from conventional sources was 33.9% lower than in April 2019, while generation from renewable sources was 3.6% higher.
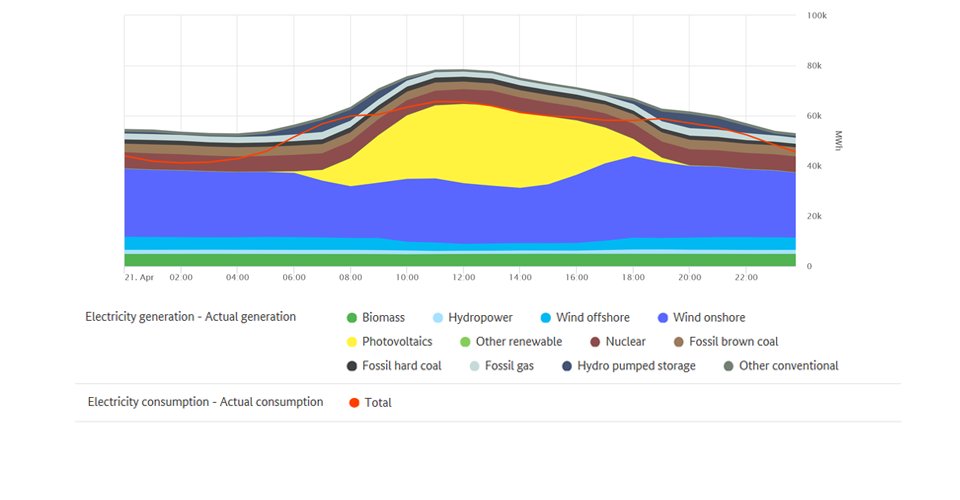
On Monday 20 April, between 12pm and 1pm, at high electricity consumption of 64 GWh, total electricity generation reached its maximum of just under 78.6 GWh, which was 1.3% below the maximum value in the same month a year earlier. Electricity generation recorded its lowest level of 27.6 GWh on Sunday 26 April between 6am and 7am, when electricity consumption was low at 37.4 GWh.
The chart illustrates electricity generation and consumption in Germany in the month of April.
Electricity consumption falls – compared to March 2020 and April 2019
Electricity generation, consumption and trading, as with almost all areas of public life and the economy, were affected by the restrictions introduced in mid-March by the federal government and the federal state governments to curb the spread of COVID-19. A look back at the month of March already showed this, with a gradual decrease in electricity consumption over the course of the calendar weeks.
Changes in electricity consumption by calendar week in April | |
Calendar week | Change compared to the previous week (percentage) |
CW 14 (30 March – 5 April 2020) | -1.23% |
CW 15 (06 April – 12 April 2020) | -10.00% |
CW 16 (13 April – 19 April 2020) | -0.70% |
CW 17 (20 April – 26 April 2020) | +6.33% |
CW 18 (27 April – 3 May 2020) | -4.71% |
Data basis: smard.de
In April electricity consumption fell in the first three weeks compared to the previous week. In the subsequent calendar week 17, when the first restrictions to curb the spread of COVID-19 were loosened, electricity consumption increased by around 6.33%. In calendar week 18, with the May Day holiday leading into an extended weekend, electricity consumption fell again.
Compared to March, electricity consumption fell by a total of 14.7%, and compared to April a year ago by 8.3%.
Highest and lowest outputs of renewable electricity generation
Electricity generation from renewable energy sources reached its highest level of 64.5 GWh on Tuesday 21 April between 12pm and 1pm.
Photovoltaic systems generated 31.5 GWh (48.8%), onshore wind farms 24.2 GWh (37.5%), and offshore wind farms 2.7 GWh (4.2%). The remaining 6.1 GWh (9.5%) came from biomass, hydropower and other renewables. Electricity consumption during this hour was also high at 65.5 GWh.
Generation from renewable sources fell to its lowest level of 8.2 GWh on Sunday 26 April between 8pm and 9pm, when electricity consumption was also low at 46.7 GWh. With 4.8 GWh, biomass accounted for the majority (58.5%); hydropower generated was at 1.6 GWh (19.5%); on and offshore wind farms together generated 1.5 GWh (18.3%); photovoltaic systems and other renewables generated 0.3 GWh (3.7%).
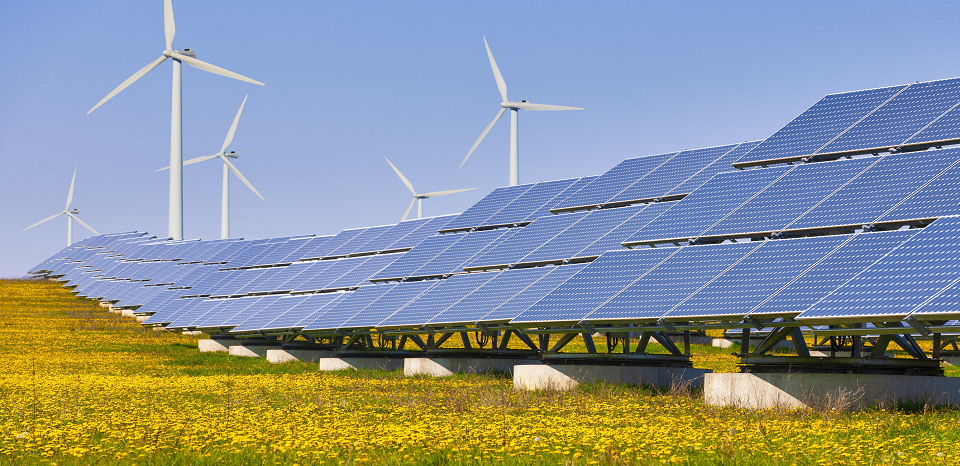
High proportion of renewable energy in electricity consumption
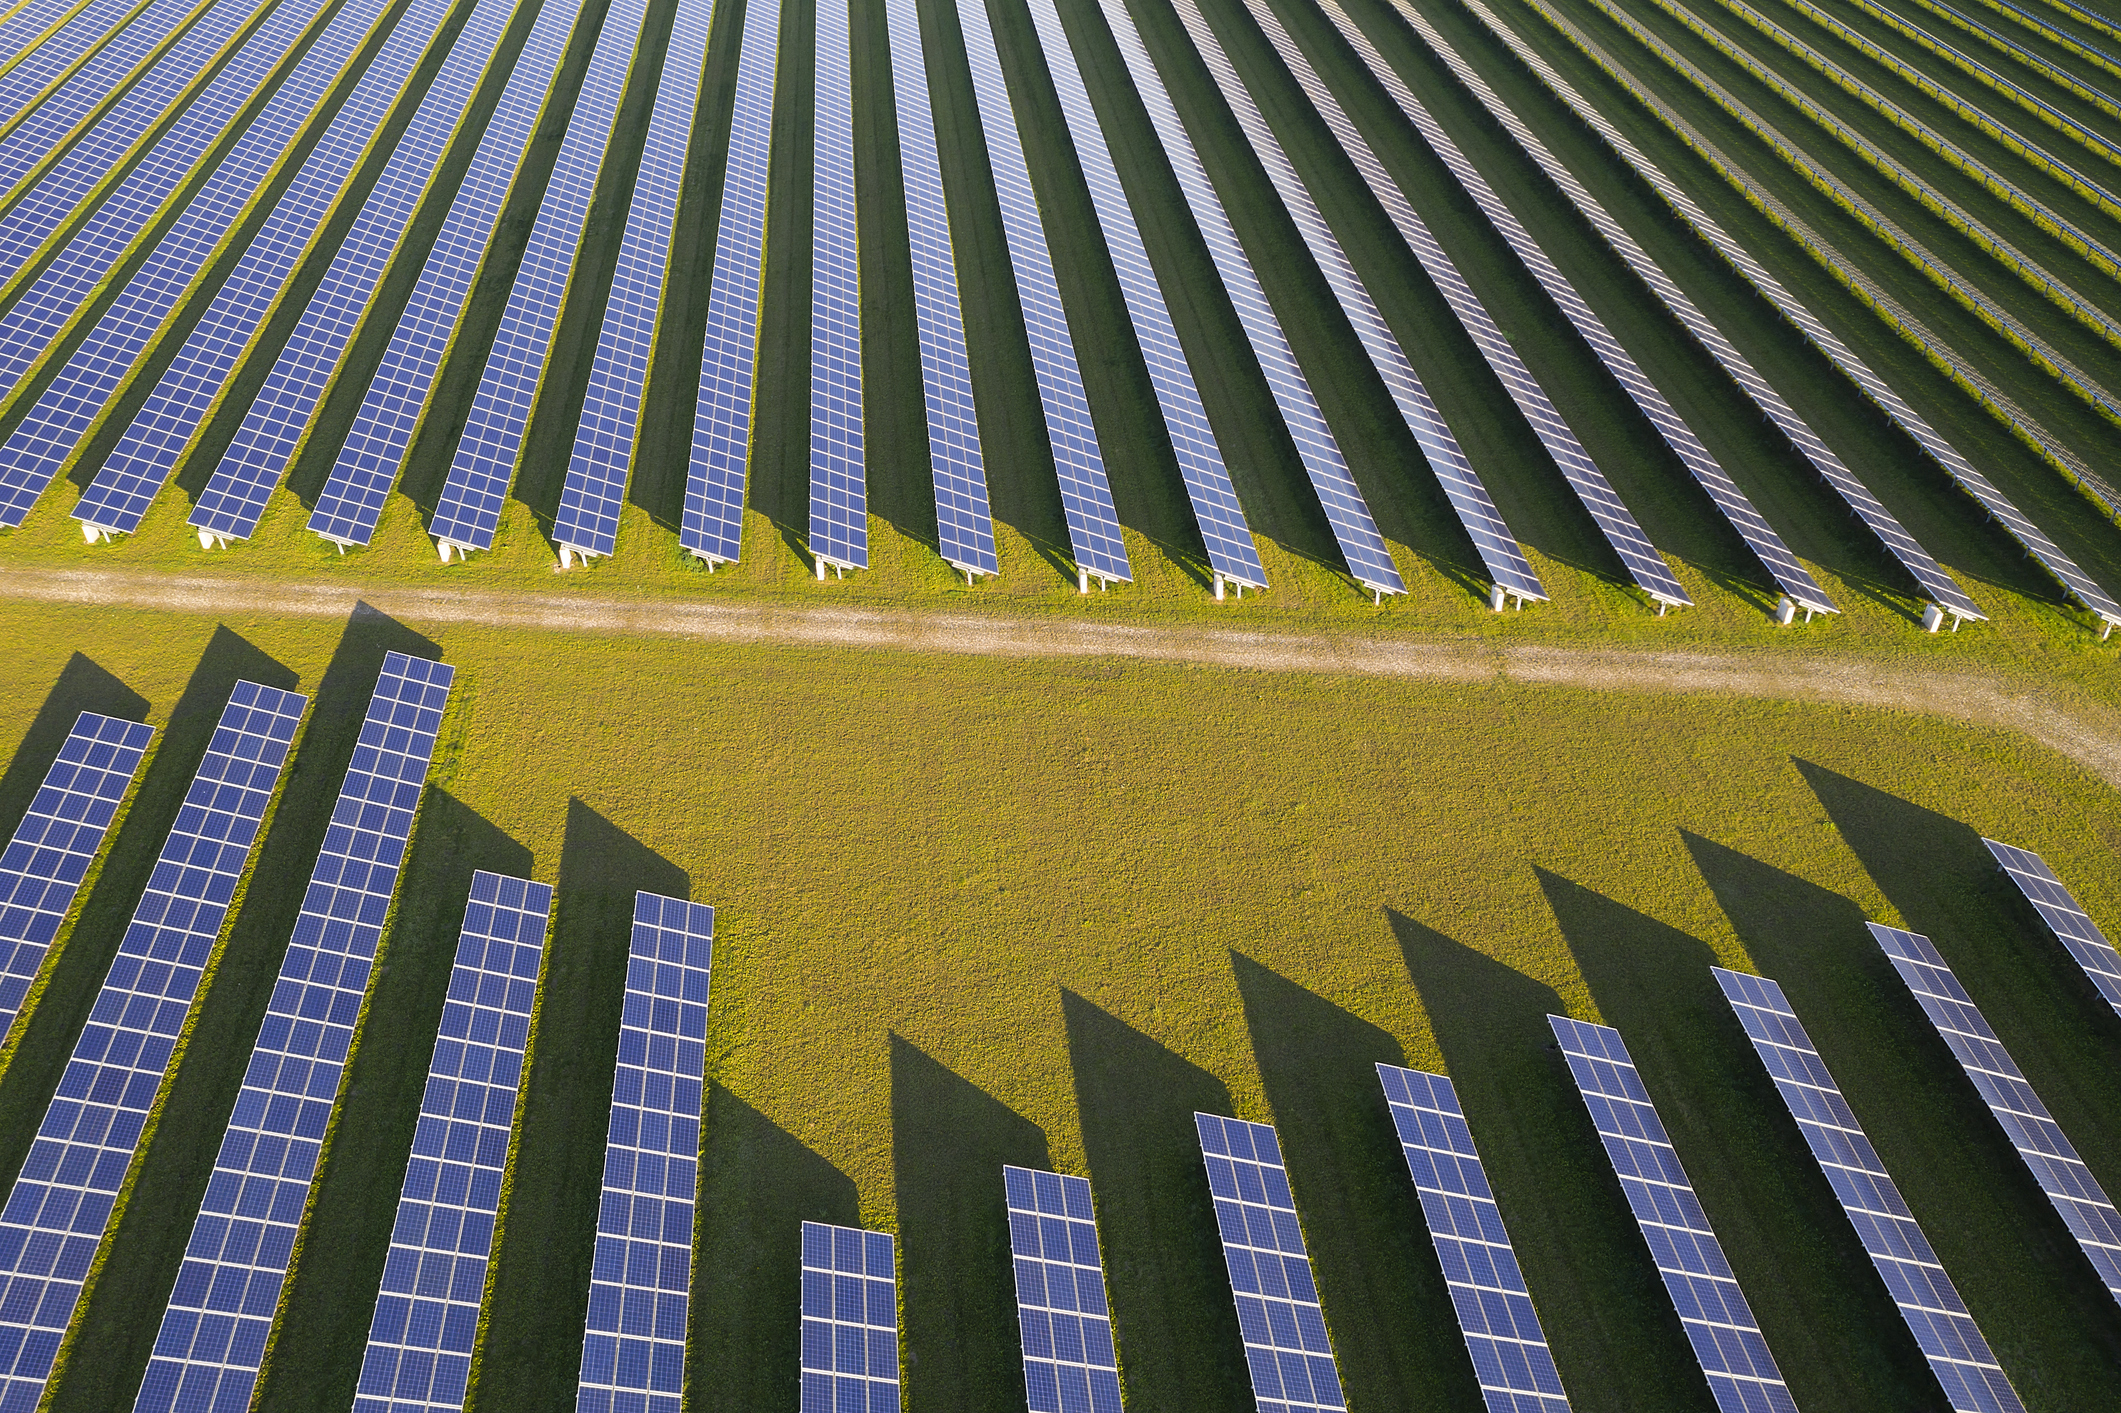
With many hours of sunshine and little rain, the sunniest April on record (Deutscher Wetterdienst) in Germany ensured a large supply (6.3 TWh) of solar power, which was an increase of 23.6% compared to the same month a year ago.
Of course this is not due solely to the favourable weather conditions: Compared with April 2019, the installed generating capacity of photovoltaic systems has increased by 2.6%, and by 24.7% since 2015.
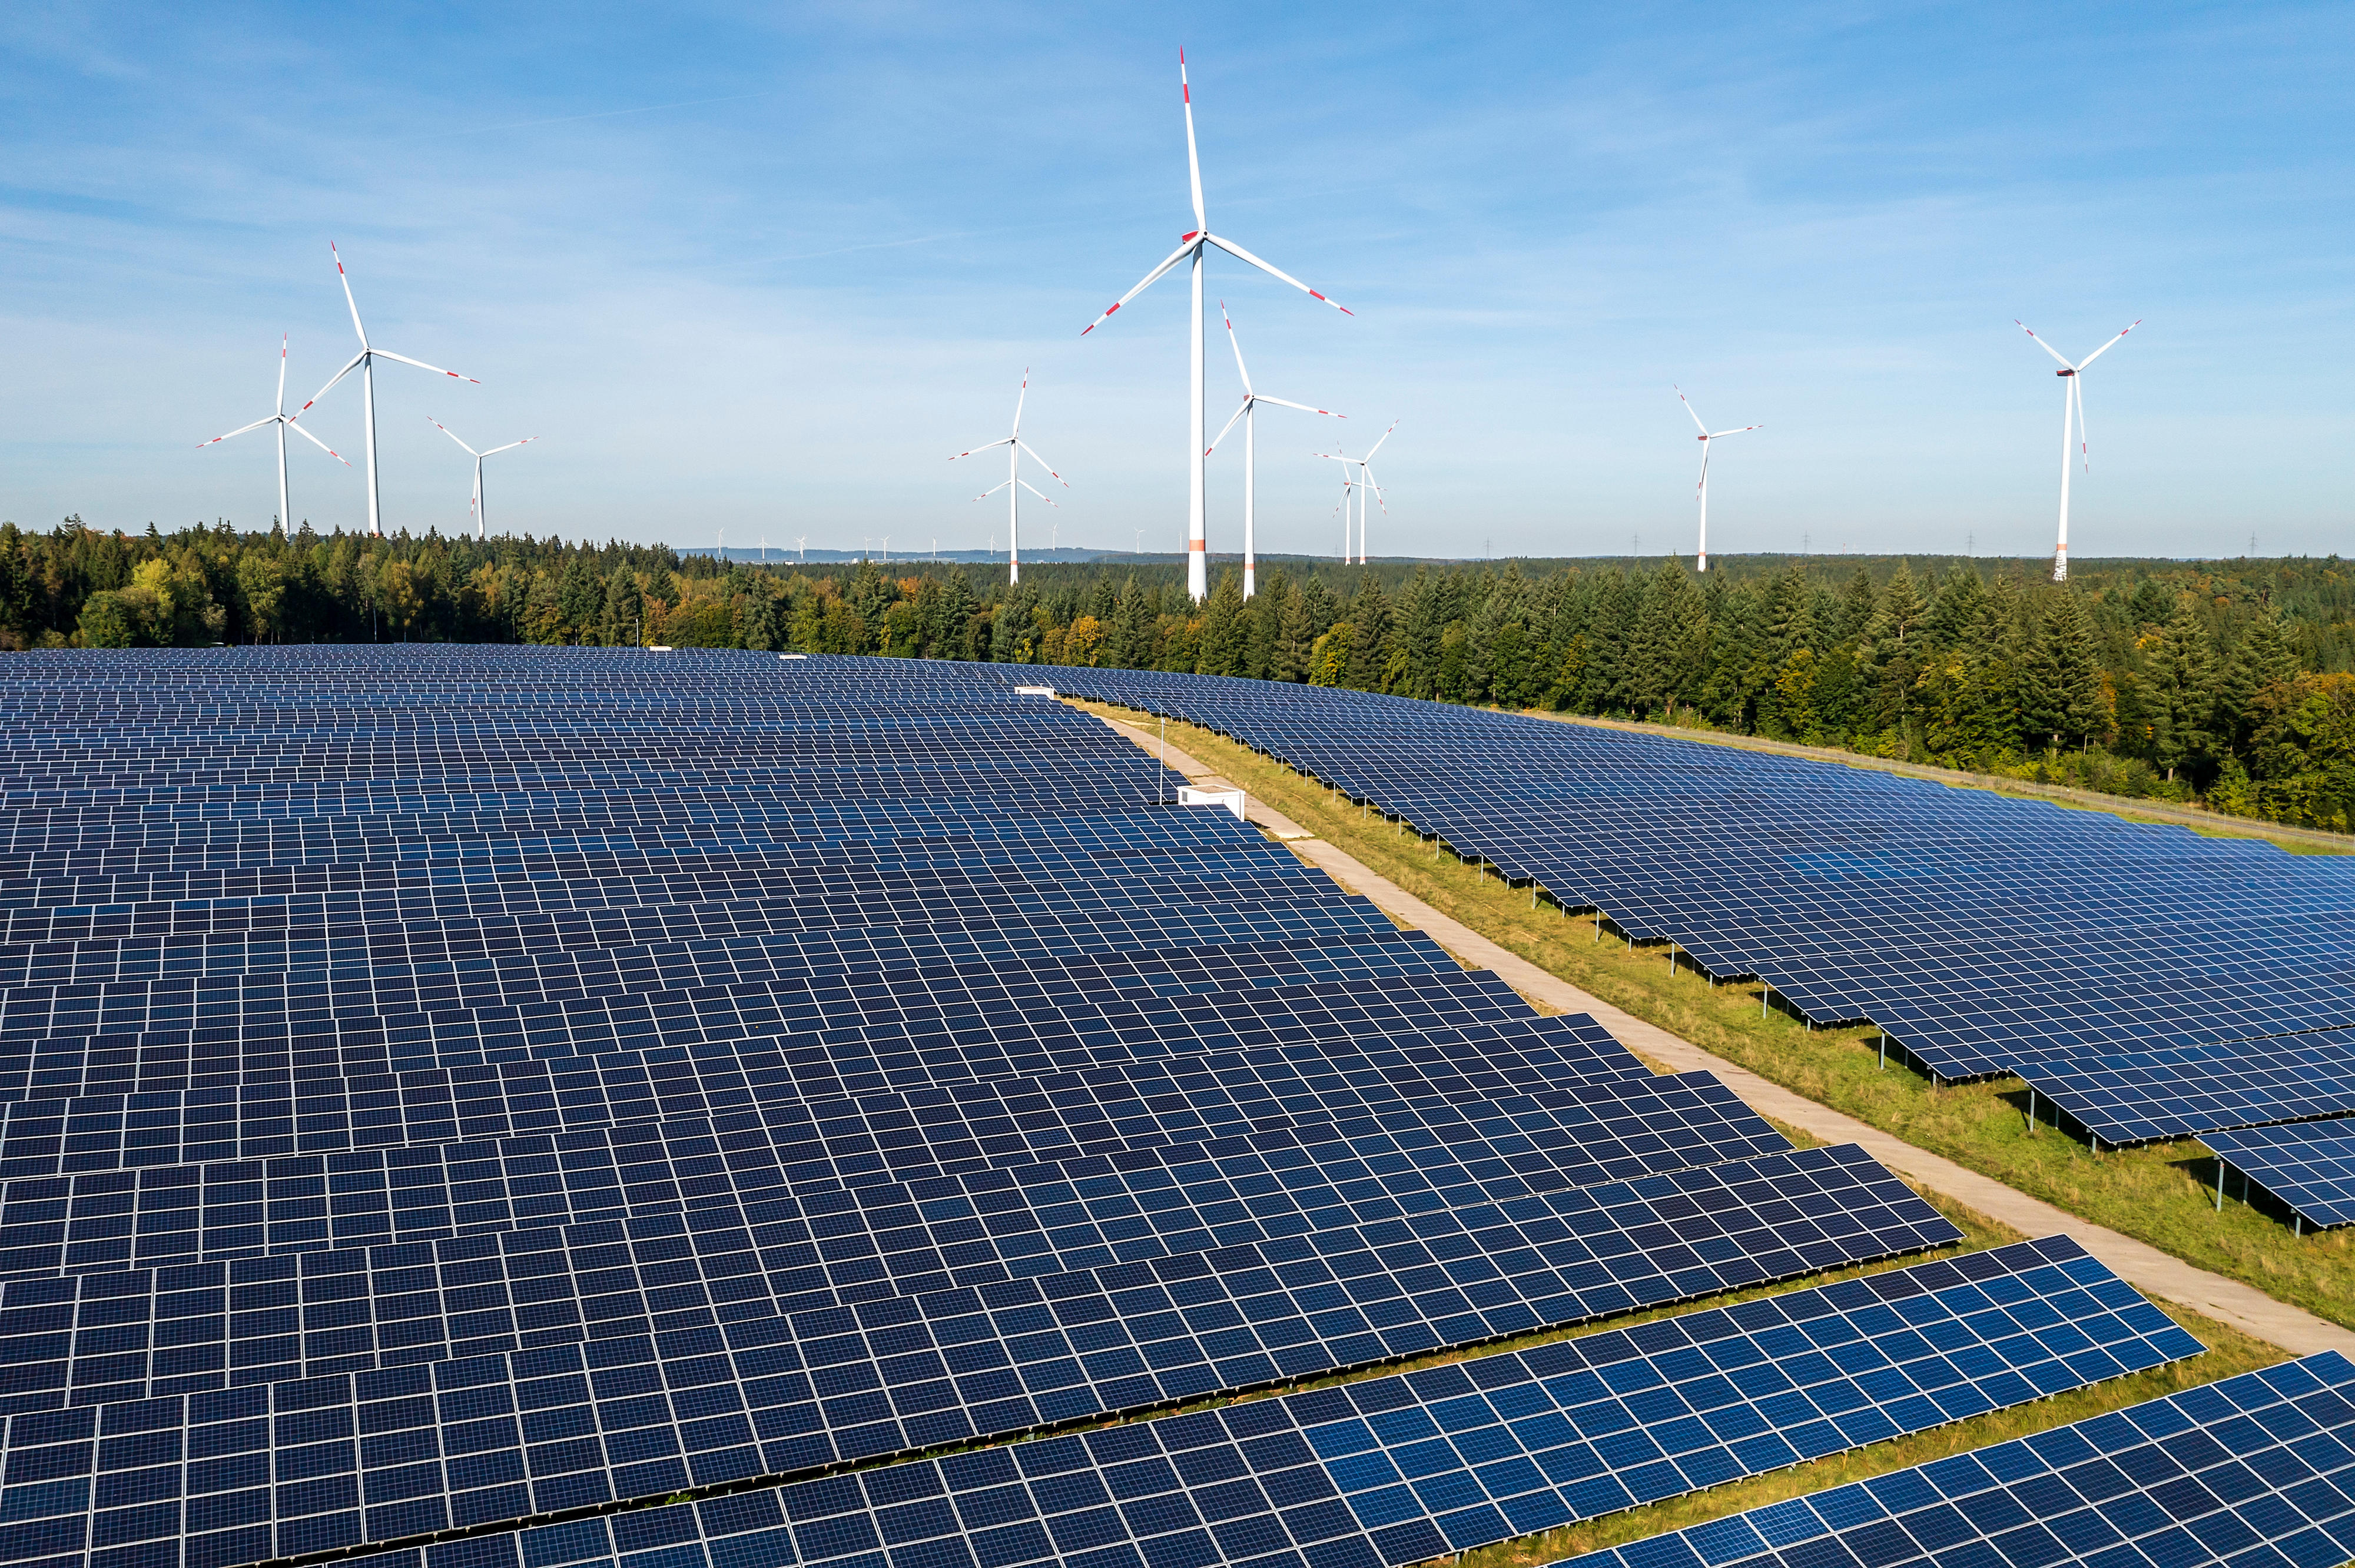
Wind output totalled 8.7 TWh, with 6.9 TWh from onshore and 1.8 TWh from offshore wind plants. This left wind power supply 2.8% lower than the value for April of the previous year.
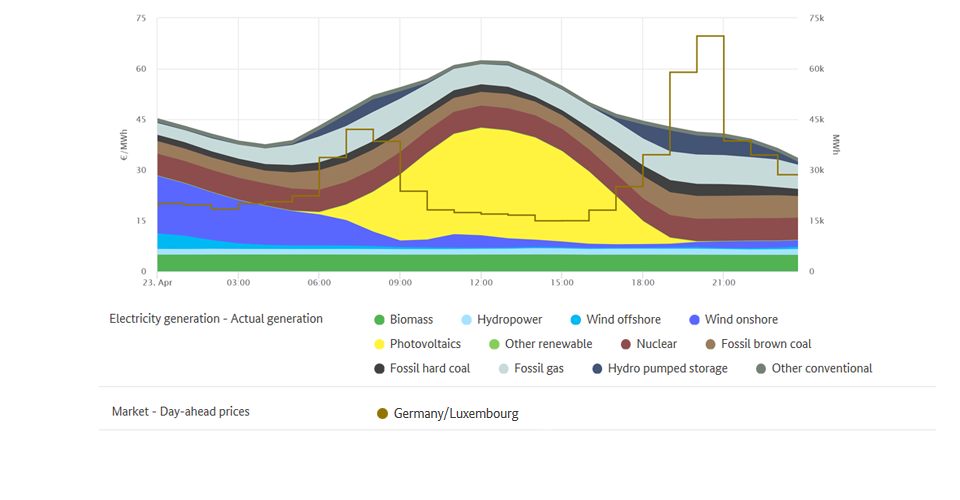
On Sunday 5 April between 11am and 5pm, renewables produced enough electricity for six consecutive hours to cover Germany’s net electricity consumption (grid load). In this time frame a total of 13.2 GWh more electricity from renewables was generated than consumed. From 19-22 April there was also a high proportion for several days, even on weekdays, when consumption values are typically higher compared to weekends. Over these four days, renewables met a total of 80.2% of Germany’s electricity demand.
The chart illustrates renewable energy generation and electricity consumption in the time frame from 19-22 April. In this time frame, renewables covered a high proportion of electricity consumption.
The wholesale electricity price in Germany
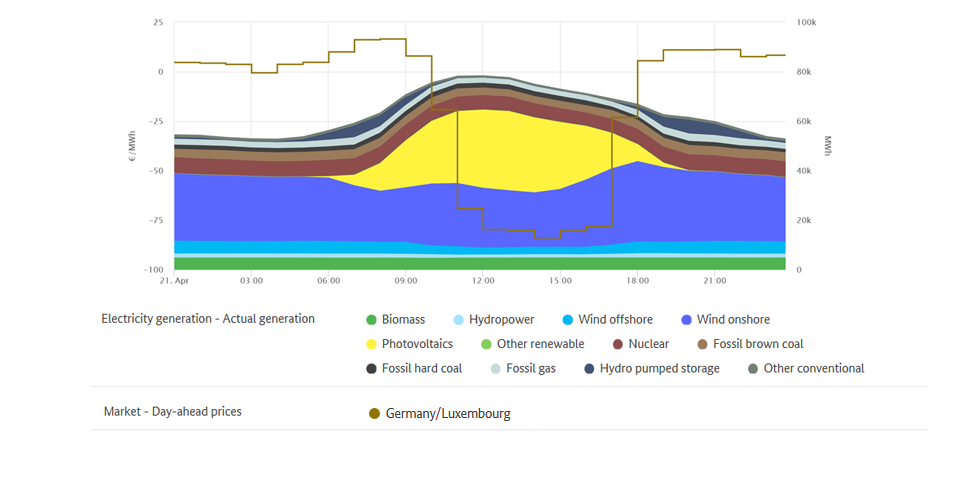
Compared with the previous year, wholesale prices for electricity fell. In April, the hourly products on the EPEX Spot day-ahead market were traded at between minus 83.94 and plus 69.68 euros per megawatt hour (€/MWh), resulting in an average of €17.09/MWh. This was €19.86 lower than the average price a year earlier (April 2019: 36.96 Euro/MWh). The reasons for this include higher renewable output, a decrease of 8.3% (-3.3 TWh) in electricity consumption and the large number of negative prices.
The lowest exchange price was recorded between 2pm and 3pm on Tuesday 21 April and at minus 83.94 euros per megawatt hour was the lowest exchange price this year. During this time, the total electricity consumption of 61.270 GWh was met almost completely by the higher level of renewable generation of 61.311 GWh. At the same time, conventional generation was low at 13.1 GWh.
Compared with the same month a year earlier, the number of hours with negative electricity prices was more than twice the number: it increased from 18 to 40 of the 720 hours of trading.
On Easter Monday 13 April there were 14 and on Thursday 21 April there were eight consecutive hours of negative electricity prices.
As a result, the "six-hour rule" took effect on a total of two days, meaning that larger new installations receiving payments under the Renewable Energy Sources Act (EEG) and selling electricity directly did not receive payment in these periods. Under the rule, if the day-ahead price on the electricity exchange is negative for a period of at least six consecutive hours, the installation operators do not receive the market premium as from the first hour in the period with negative prices. The rule also took effect twice in April 2019.
On the day-ahead market, the highest price of the past month of €69.68/MWh was recorded on Thursday 23 April between 8pm and 9pm. In this hour, electricity consumption was high at 55 GWh and there was a low level of generation from renewables (8.7 GWh). The electricity market reacts to this kind of situation by taking power from storage facilities (such as pumped storage stations), reducing the consumption of flexible loads and increasing the use of conventional power stations with higher marginal costs, in particular gas-fired power plants.
Wholesale prices in Germany | ||
| April 2020 | April 2019 |
Average [€/MWh] | 17.09 | 36.96 |
Minimum [€/MWh] | -83.94 | -83.01 |
Maximum [€/MWh] | 69.68 | 60.33 |
Number of hours with negative prices | 40 | 18 |
Data basis smard.de
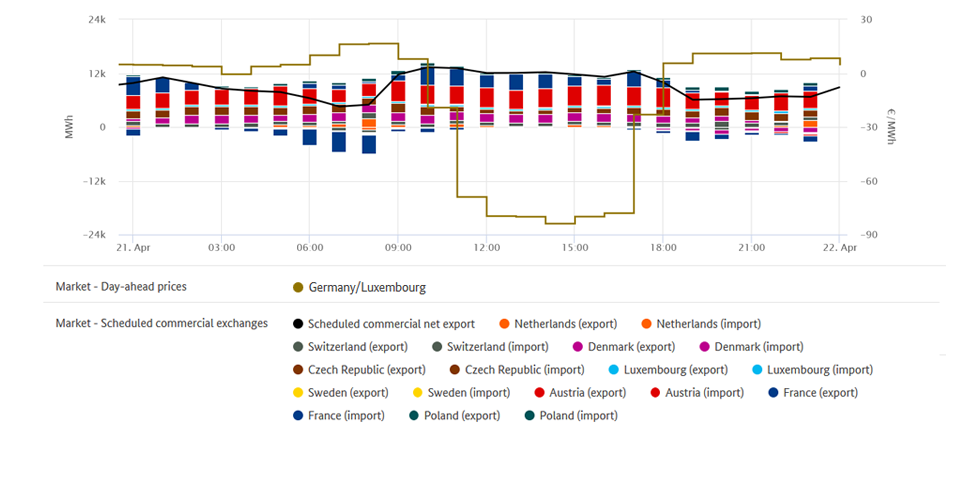
Commercial foreign trade
Germany’s commercial net exports for April
fell by 116.7% compared with the same month of the previous year. For the first time since August 2019 Germany was a net importer, with 596.4 GWh.
A total of 2.4 TWh were exported, which corresponds to 6.9% of the electricity that was produced in this time frame in Germany. The main customer for Germany's net exports of electricity (exports less imports) was Austria, which accounted for 1,337 GWh (up 28% compared with the previous year). Czechia followed in second place with 504 GWh (up 67%), ahead of Poland with 275 GWh (up 22%).
One reason for the large increase in exports to Czechia was the number of hours in which electricity from Germany was cheaper. This was the case in 401 of the 720 hours of trading. In April 2019, electricity from Germany was cheaper than in Czechia in only 393 of the 743 hours of trading.
Germany was a net importer from France (1,030 GWh; up 237%), Switzerland (987 GWh; up 1,063%), Denmark (654 GWh; up 96%), Sweden (205.4 GWh; up 395%) and the Netherlands (105 GWh; down 89%).
The average wholesale price in each of these countries was at least 50% beneath the previous year’s price.
The largely lower electricity prices could be the reason for the strong rise of imports (up 1,063%) from Switzerland. Electricity from Switzerland was cheaper in 430 of the 720 hours of trading, with 26 hours of negative electricity prices. In April 2019 German prices were cheaper in more than half of all the trading hours, with four hours of negative prices in Switzerland.
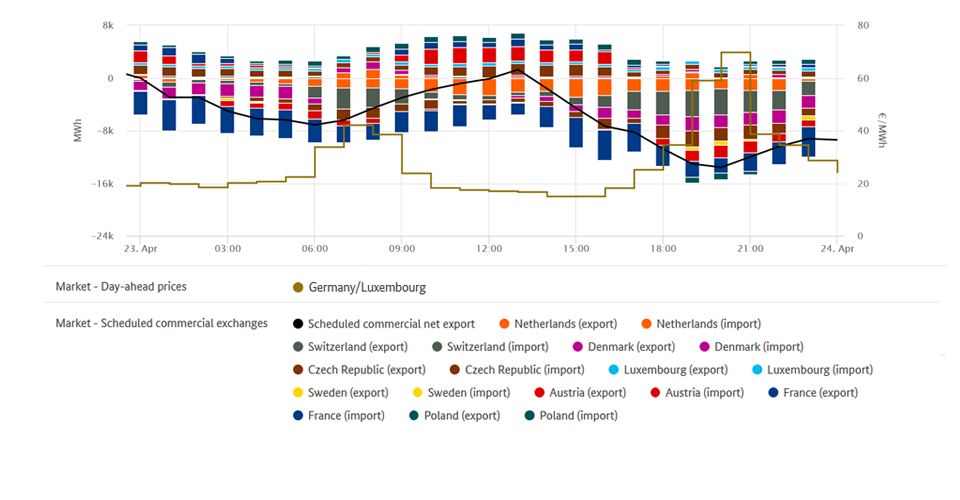
The chart gives an overview of Germany's commercial electricity trade. (Gross) exports are shown above the zero line while (gross) imports are shown below the zero line.
Changes in imports and exports are the result of frequent price fluctuations, which reflect the interaction of supply and demand in the respective countries and across borders. These fluctuations are part of normal market activity in the European wholesale electricity trade.
Market data graphs gallery