Hint: This website is not optimized for your browser version.
The electricity market in the second quarter of 2025
More than two thirds renewables
10 July 2025 – In the second quarter of 2025 a total of 102.0 TWh of electricity was generated in Germany, an increase of 0.8% on the second quarter of 2024. Renewables made up 67.5% of generation. Electricity consumption was down 1.9%. In commercial foreign trade, net imports fell.
Largest ever proportion of renewables in a quarter
Electricity consumption (grid load*) in Germany totalled 107.3 terawatt hours (TWh) in the second quarter of 2025, down 1.9% on the same quarter of 2024 (109.4 TWh). Electricity generation, by contrast, rose 0.8% to 102.0 TWh (Q2 2024: 101.1 TWh).
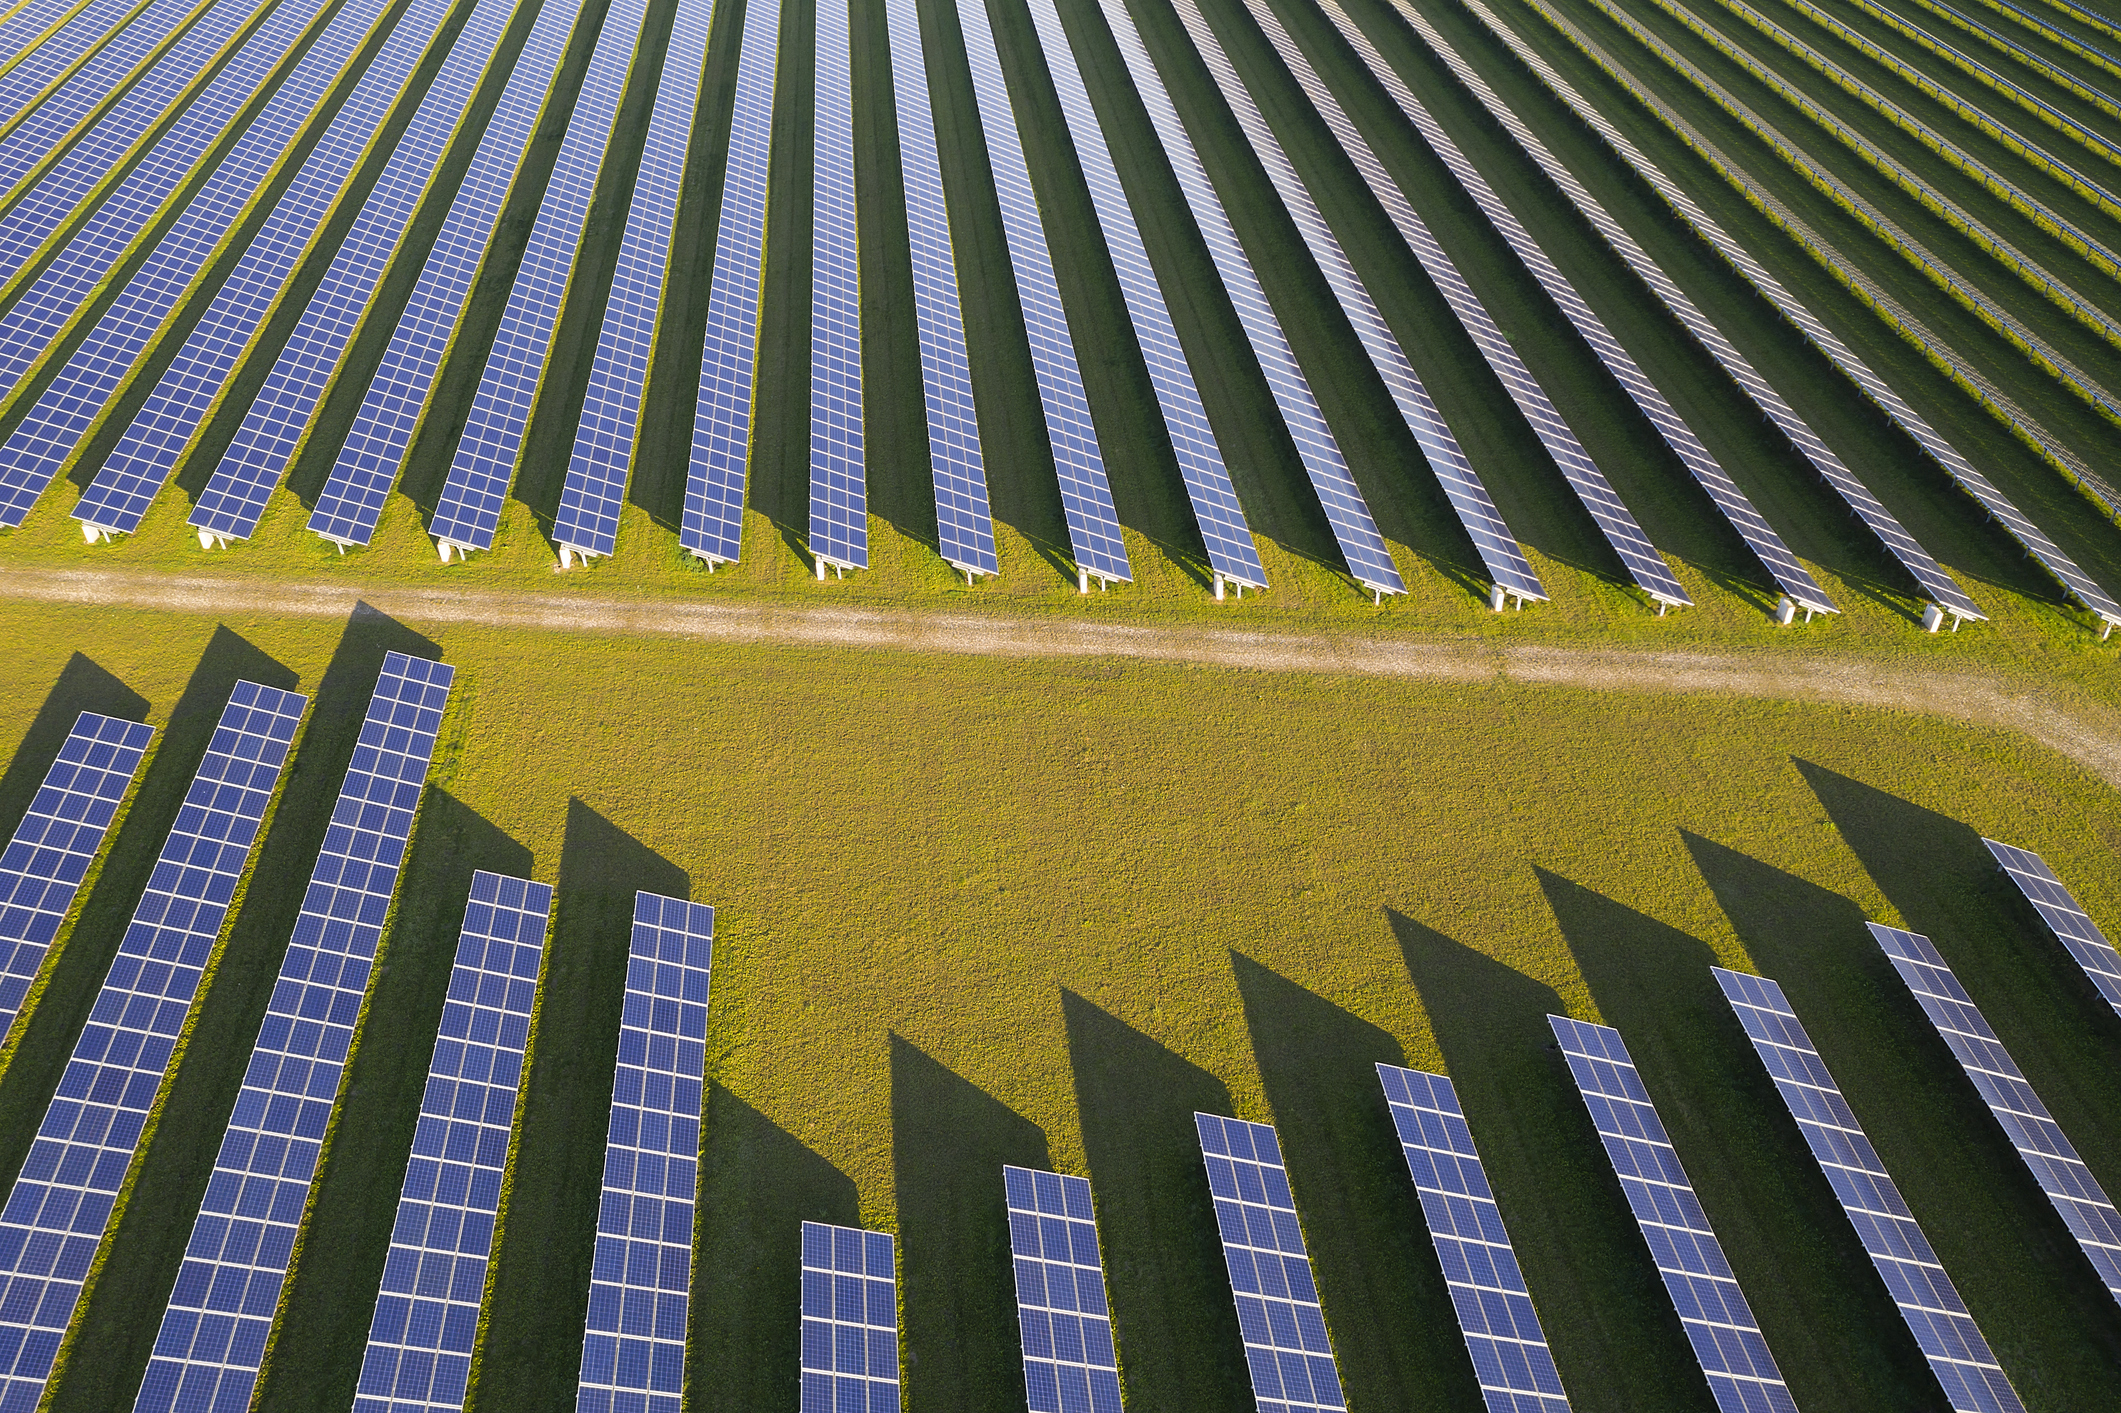
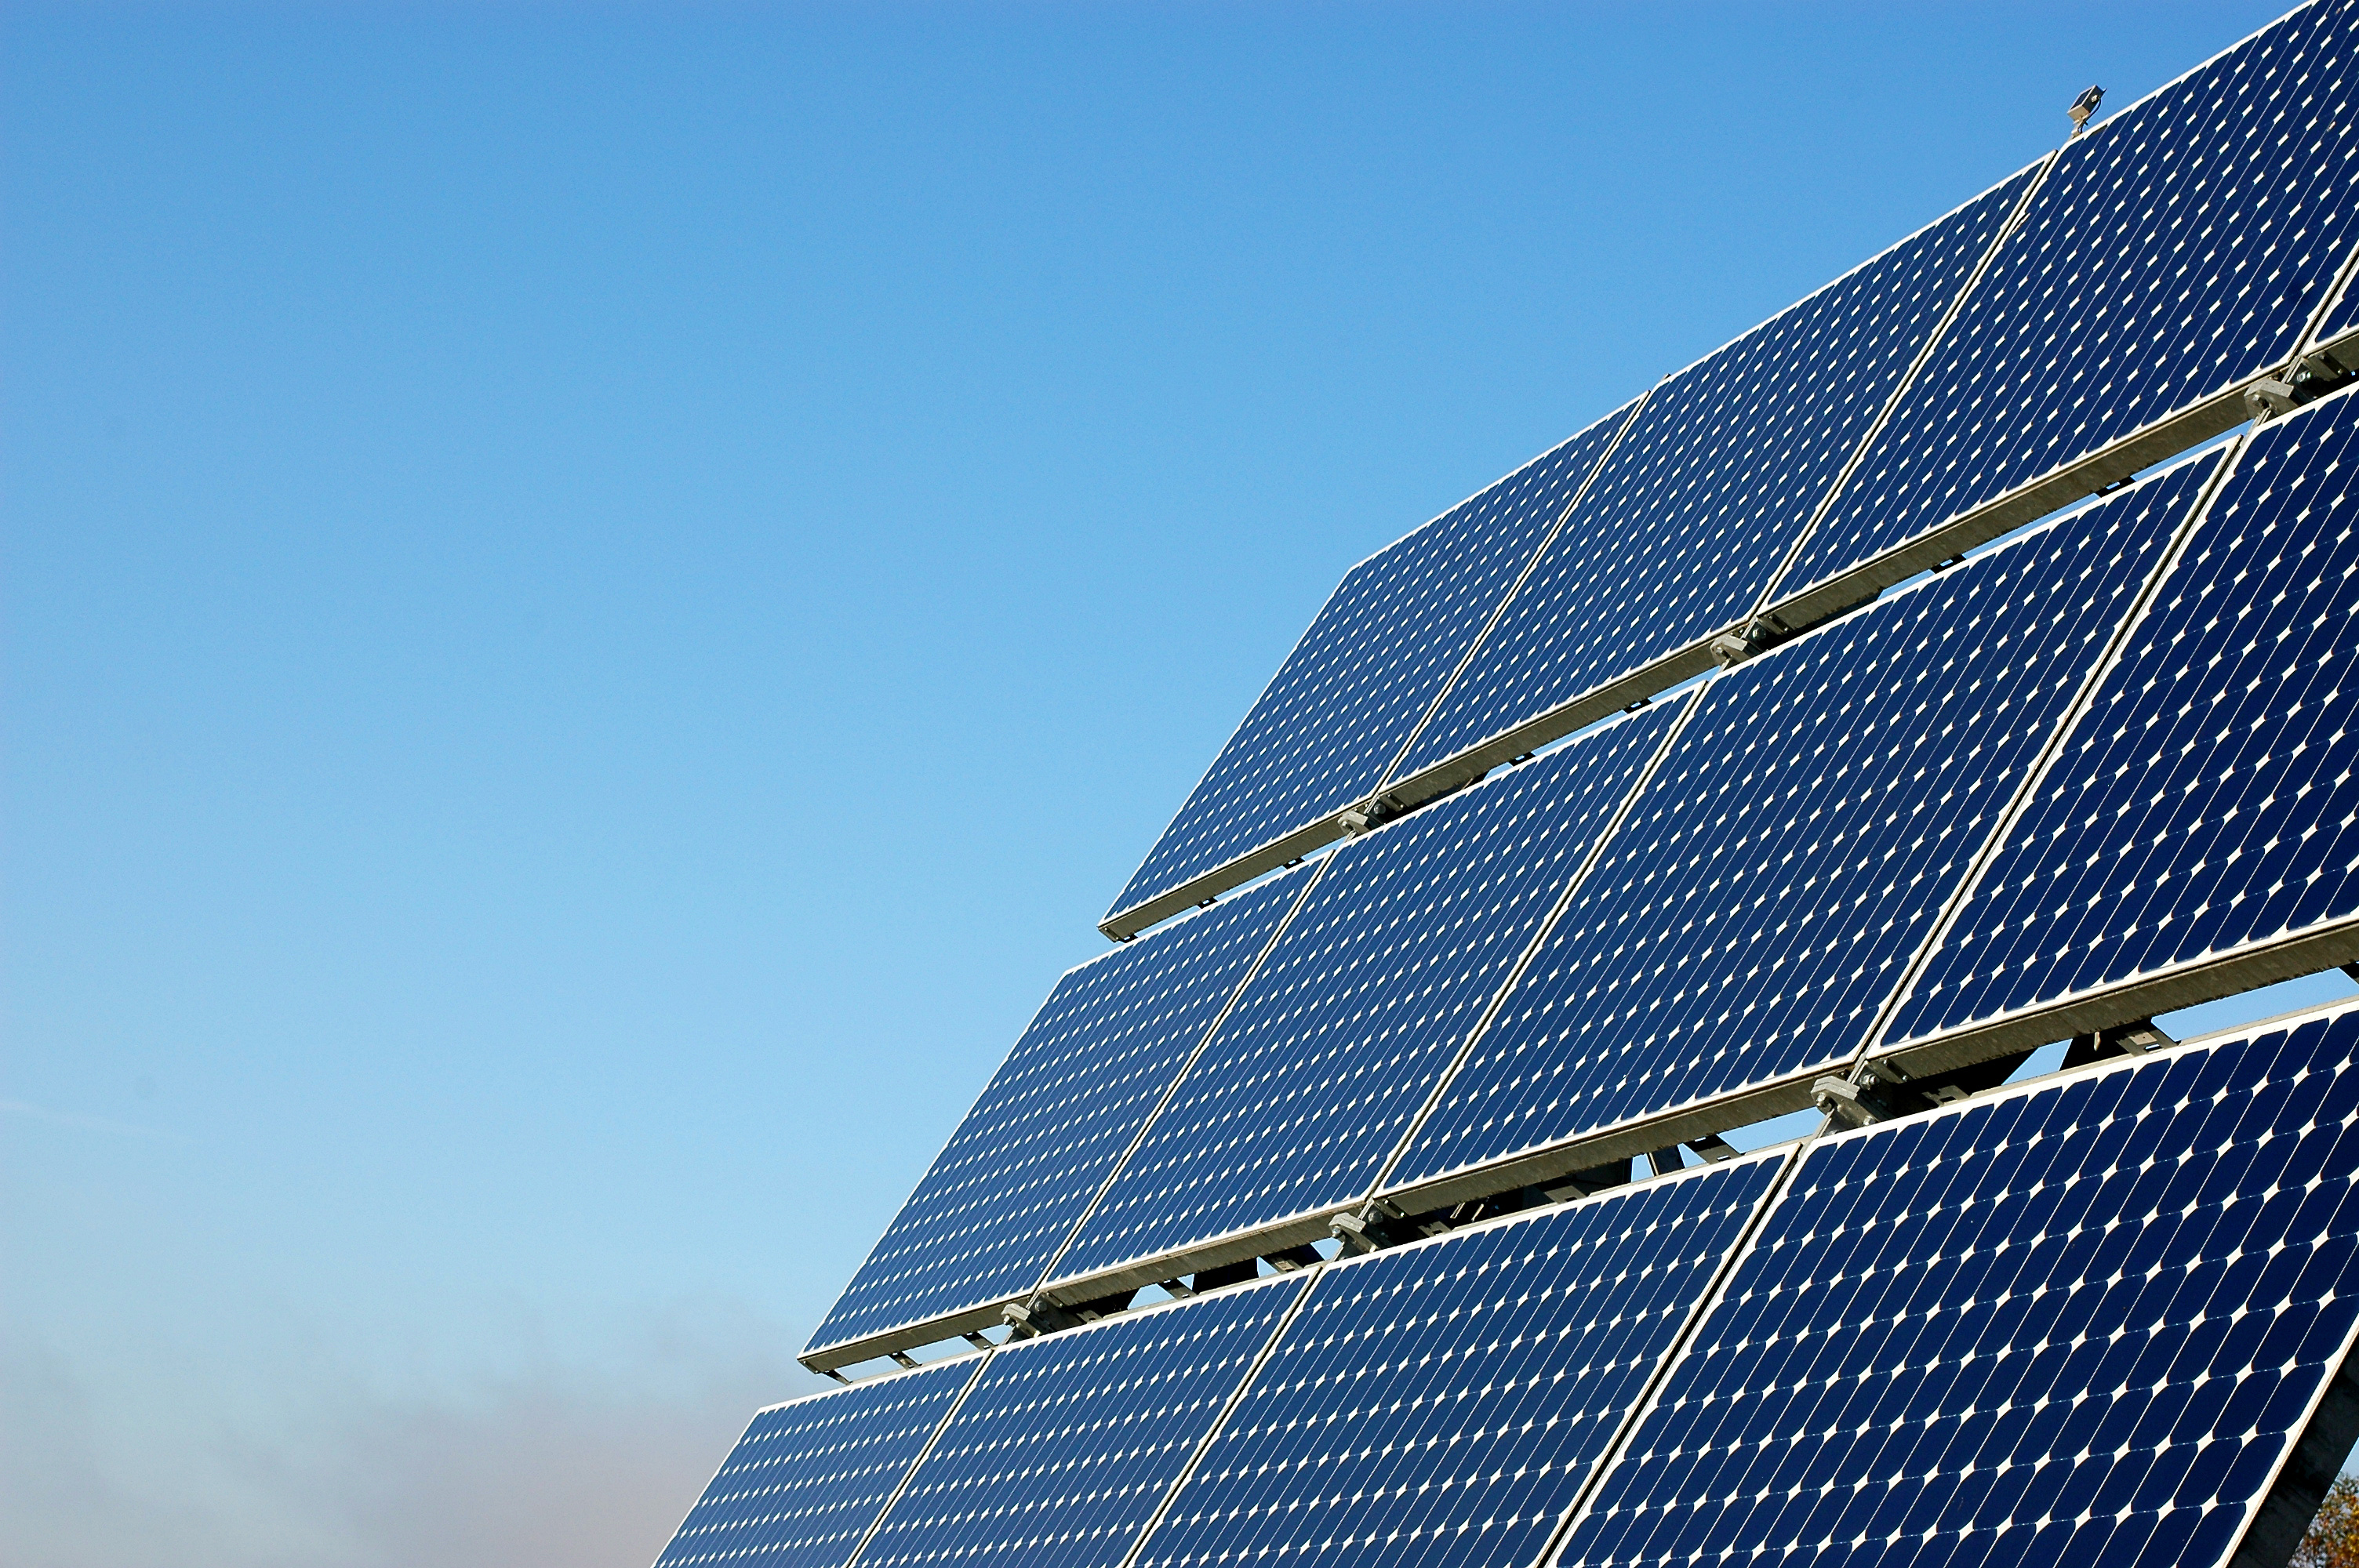
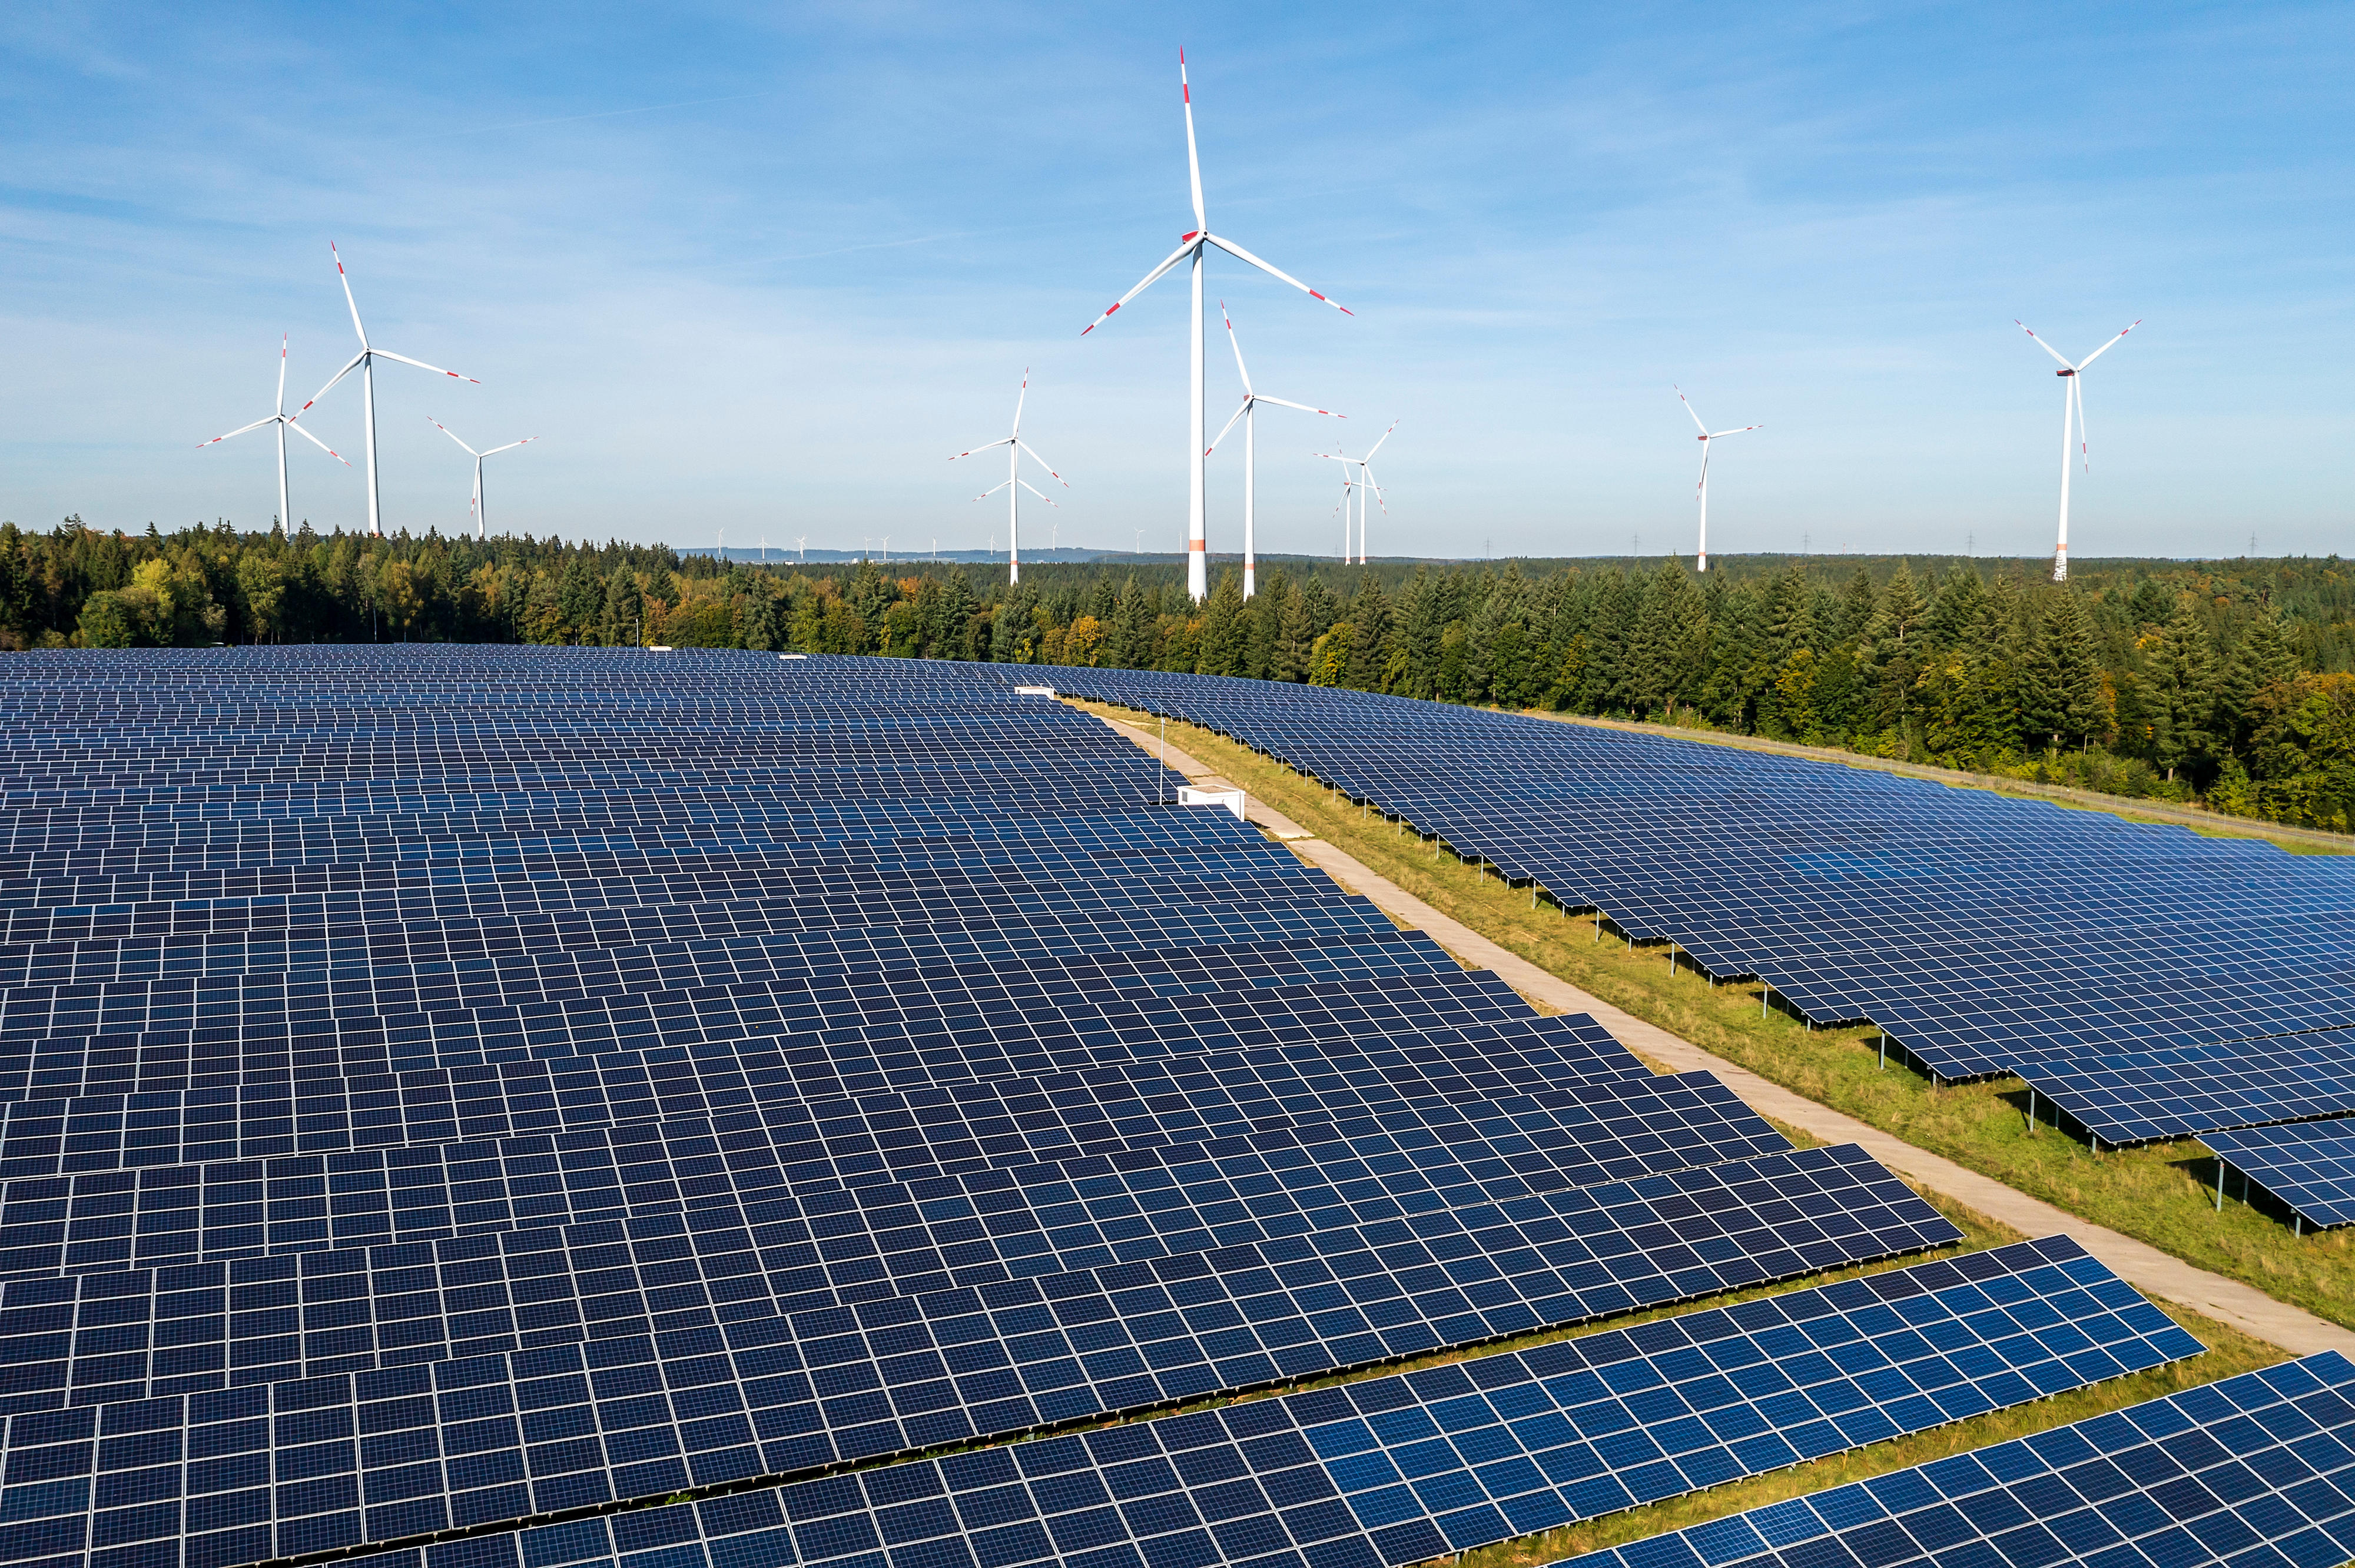
Renewables’ share of actual generation** was 67.5%. That is the highest quarterly proportion ever, breaking the previous record of 64.1% from the same quarter of last year. What is especially remarkable is that, while almost all renewables produced less electricity in both absolute and percentage terms, onshore wind and, in particular, solar showed significant growth.
In the first quarter of this year, just under 50% of electricity was generated from renewable energy sources, primarily due to the unsettled weather. Wind and solar installations were not often producing much electricity at the same time and there were several periods in which neither of them was generating much at all (in German). The picture in the second quarter was very different, with solar and onshore wind each recording their highest-ever second quarters and solar actually setting its all-time record. A separate article explains how temporary solar peaks affect the electricity market.
As in the same quarter of the previous year, solar made up the largest share of all energy sources in the German electricity generation mix (29.0 TWh), clearly surpassing its own previous quarterly high of 24.1 TWh from Q2 2024. Besides the continual progress in expanding generating capacity, the unusually sunny weather (DWD, in German) was the main reason for the rise.
Generation from gas-fired power stations was down 21.1% from the same period of last year to 9.2 TWh. The decline was primarily caused by the higher wholesale prices for gas, which averaged €36.58 per megawatt hour (MWh) in Q2 2025, a rise of about 16% on the year before (Q2 2024: €31.55/MWh). The high availability of renewable energy sources also contributed to the lower use of gas power plants compared to the second quarter of 2024.
While the drop in fuel prices caused hard coal to make up a somewhat larger share of electricity generation than in the second quarter of the previous year, lignite had its lowest quarterly result since at least 2015 (13.1 TWh).
Germany’s wholesale prices rose more slowly than those of its neighbours
The average wholesale electricity price on the day-ahead market in Germany (€69.73/MWh) was slightly higher than in the second quarter of 2024 (€67.48/MWh). In neighbouring countries, meanwhile, the average day-ahead price was €65.14/MWh, but this figure represented a steeper increase (Q2 2024: €58.94/MWh).
The highest wholesale price was recorded between 8pm and 9pm on Monday 30 June 2025. Day-ahead electricity was trading at €288.97/MWh at that time. Little electricity was generated by wind or solar during the evening. In Germany’s neighbours, the wholesale price was €229.00/MWh, leading to net imports of 0.9 TWh that made more economic sense than generating the power domestically.
Negative wholesale prices were recorded in 345 of the 2,184 hours of the quarter, while prices were negative in 137 hours in neighbouring states. Germany’s lowest price of the quarter was recorded between 1pm and 2pm on Sunday 11 May (negative €250.32/MWh). Negative wholesale prices occur when the supply on the electricity market exceeds demand. This typically happens when a high and inflexible level of generation from wind and solar energy meets low demand, as is usual on Sundays and bank holidays.
Q2 2025 | Q2 2024 | |
Average [€/MWh] | 69.73 | 67.48 |
Minimum [€/MWh] | -250.32 | -135.45 |
Maximum [€/MWh] | 288.97 | 235.52 |
Number of hours with negative prices | 345 | 192 |
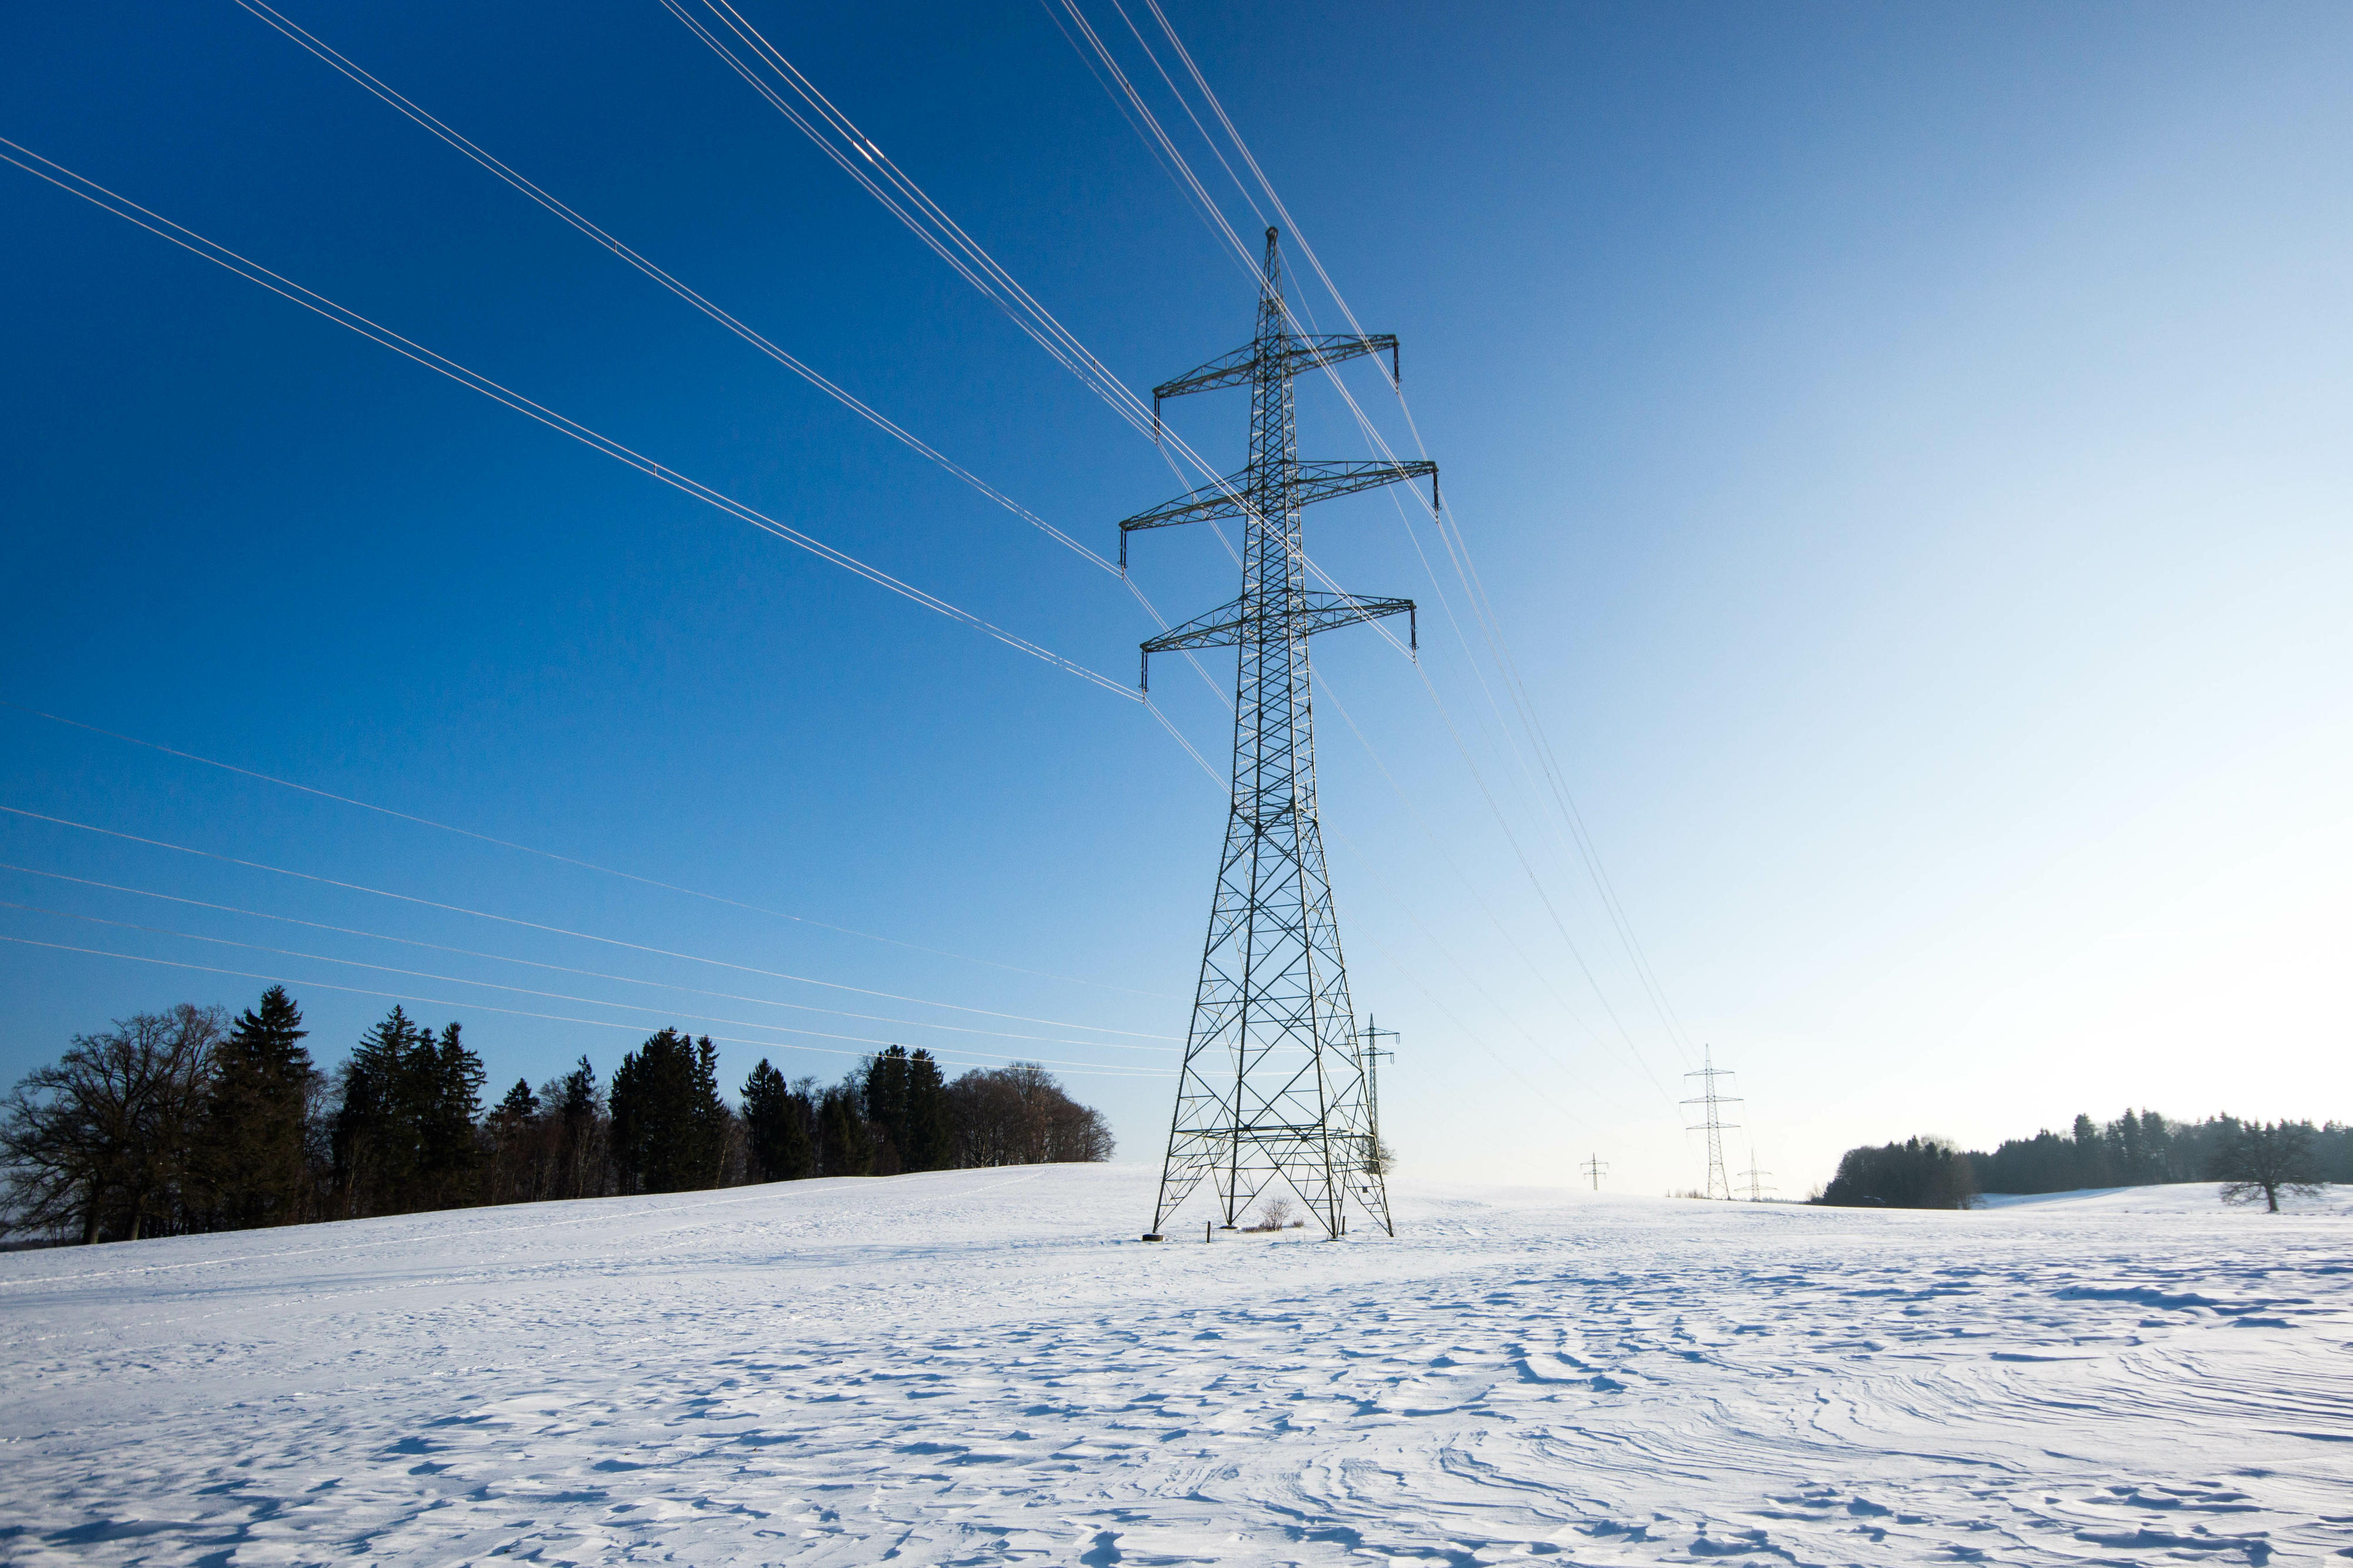
Commercial foreign trade
German electricity imports fell 16.7% from the second quarter of 2024 to 14.9 TWh. The largest amounts were imported from Denmark (3.1 TWh), followed by France (2.8 TWh) and Switzerland (2.6 TWh).
Not including imports from Switzerland***, 54.4% of imported electricity came from renewable energy sources, up from 51.5% in Q2 2024. Switzerland is not currently providing a breakdown of its generation by energy source to the European Network of Transmission System Operators for Electricity (ENTSO-E), so imports from there are being classed as “unknown”. While energy source data from Switzerland are unavailable, its imports are being removed from the figure for total imports before the proportion of renewables is calculated so that the comparison between quarters is as accurate as possible.
The commercial foreign trade data from the second quarter of 2024 show that a similar proportion of total imports came from Switzerland (17%). In Q2 2024, 41.2% of Swiss imports came from renewable sources. It is therefore likely that a breakdown of Swiss imports by energy source will lead to a slight downward correction in the proportion of renewables in total imports.
Total exports of electricity, on the other hand, were up 23.6% to 8.5 TWh, with the largest amounts being imported by Austria (2.1 TWh), followed by Denmark (1.3 TWh) and Czechia (1.2 TWh). Renewables made up 72.3% (Q2 2024: 71.0%). The largest share of exports was contributed by solar (34.9%), followed by onshore wind (21.8%). A large proportion of wind and solar in the grid load – that is, a low residual load – is often associated with rising exports and falling imports since the low marginal costs of renewables are a main reason why domestic generation is more economically attractive than purchasing electricity from abroad.
The major blackout that occurred on the Iberian Peninsula on 28 April had no measurable impact on German foreign trade in electricity.
Thanks to the European internal market, electricity can always be generated wherever it is cheapest to produce. Electricity market participants can often buy electricity more cheaply where it can be produced more economically, rather than generating it at higher prices in their own countries.
An overview of Germany’s commercial foreign trade in electricity in the second quarter of 2025:
- Austria:
Exports: 2,066.4 GWh, Imports: 379.5 GWh - Belgium:
Exports: 411.4 GWh, Imports: 743.0 GWh - Czechia:
Exports: 1,209.0 GWh, Imports: 524.4 GWh - Denmark 1:
Exports: 1,009.7 GWh, Imports: 2,342.2 GWh - Denmark 2:
Exports: 271.9 GWh, Imports: 779.9 GWh - France:
Exports: 520.4 GWh, Imports: 2,786.6 GWh - Netherlands:
Exports: 615.3 GWh, Imports: 1,858.4 GWh - Norway:
Exports: 415.6 GWh, Imports: 1,536.3 GWh - Poland:
Exports: 988.2 GWh, Imports: 555.4 GWh - Sweden:
Exports: 192.3 GWh, Imports: 766.6 GWh - Switzerland:
Exports: 2,581.9 GWh, Imports: 807.9 GWh
_________________________________________________________
*The grid load share of electricity that was generated from renewables is calculated differently from the federal government’s target definitions for the expansion of renewable energy under the Renewable Energy Sources Act (EEG), where the basis for calculation is gross electricity consumption. The grid load does not include power stations’ own consumption or industrial networks, so the calculation basis applied here – compared with the share of gross electricity consumption – typically results in a higher proportion of generation from renewables. The grid load is calculated by taking the net electricity generation, subtracting transmission capacity exports, adding transmission capacity imports and subtracting the pumping work at pumped storage power stations.
**The actual generation is the net electricity generation. It is the electricity fed into the general supply network less the electricity consumed by power plants themselves. It does not include electricity generated in the Deutsche Bahn network or within industrial networks and closed distribution networks.
***Further information about how the energy mix of electricity imports and exports is calculated is available here. The energy mix of imports from Switzerland is not currently being transmitted. These imports are therefore currently being classed as “unknown” so as not to distort the overall breakdown. The Bundesnetzagentur will publish information showing imports by energy source as quickly as possible.
The figures presented in the charts and in the text may be updated at a later date. Further information about possible updates and data definitions is available (in German) in the user guide.