Hint: This website is not optimized for your browser version.
High solar generation - Electricity generation and electricity trading in March 2020
17 April 2020 – Electricity generation and electricity consumption in Germany were down 9.1% and 2% respectively compared with a year earlier. The average wholesale price was €22.49/MWh, which was lower than the average price in the same month a year earlier. Commercial net exports fell by 59%.
Electricity generation from renewable and conventional energy sources totalled 42.8 TWh in March (2019: 47.1 TWh). Generation from conventional sources was 13.8% lower than in March 2019 and generation from renewable sources was 4.6% lower.
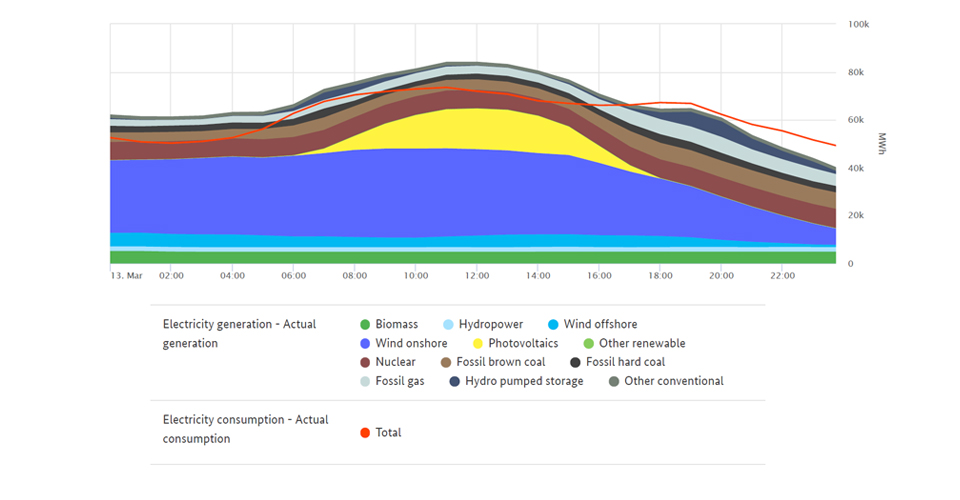
On Friday 13 March, between 12pm and 1pm, total electricity generation reached its maximum of just under 84 GWh, which was 1.6% above the maximum value in the same month a year earlier, and electricity consumption was also high at 72 GWh. Electricity generation recorded its lowest level of 33.5 GWh on Saturday 14 March between 4am and 5am, when electricity consumption was also low at 45.9 GWh.
The chart illustrates electricity generation and consumption in Germany in the month of March.
Electricity consumption falls following coronavirus measures
Electricity generation, consumption and trading, as with almost all areas of public life and the economy, were affected by the restrictions introduced in mid-March by the federal government and the federal state governments to curb the spread of COVID‑19. This was reflected for instance in the decrease in electricity consumption. Consumption was down just 2% from March of last year. One reason for this small decrease is the increase of 1.3% in consumption in the first week of March. Another reason is that some energy-intensive manufacturing companies operate their own generating facilities on site. Since the electricity produced is not fed into the public grid, the amount of electricity consumed is not included in the SMARD data.
In the week commencing 16 March, the first week when all schools and childcare facilities in Germany were closed and many employers facilitated home working, electricity consumption was 4.8% or 475 GWh down on the previous week. In the following week, consumption fell by a further 4% or 377.5 GWh after the introduction of further restrictions on economic and social life to fight the spread of coronavirus.
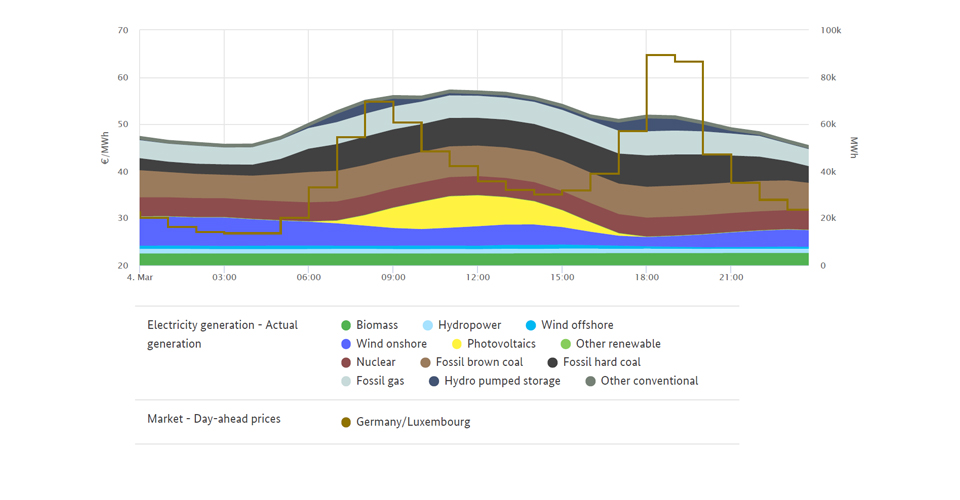
The chart illustrates electricity consumption and wholesale prices in March.
Highest and lowest outputs of renewable electricity generation
Electricity generation from renewable energy sources reached its highest level of 64.5 GWh on Friday 13 March between 12pm and 1pm, when total electricity generation also reached its maximum.
Onshore wind farms generated 36.1 GWh (56%), offshore wind farms 4.9 GWh (7.6%), and photovoltaic systems 16.9 GWh (26.2%). The remaining 6.6 GWh came from biomass, hydropower and other renewables. Electricity consumption during this hour was also high at 72 GWh.
Generation from renewable sources fell to its lowest level of 8.7 GWh on Saturday 14 March between 5am and 6am, when electricity consumption was also low at 46.1 GWh. Biomass accounted for the majority at 4.5 GWh (52%), while hydropower and onshore wind farms accounted for around 1.9 GWh each (21% and 22% respectively). Offshore wind farms and other renewables generated an almost equal share of the remaining 5% (0.45 GWh). There was no generation from photovoltaic systems at that time of day, around one and a half hours before sunrise.
High solar and less wind generation
The many hours of sunshine and low rainfall in March led to an increase in solar generation to 4.1 TWh, up 34.5% compared with a year earlier.
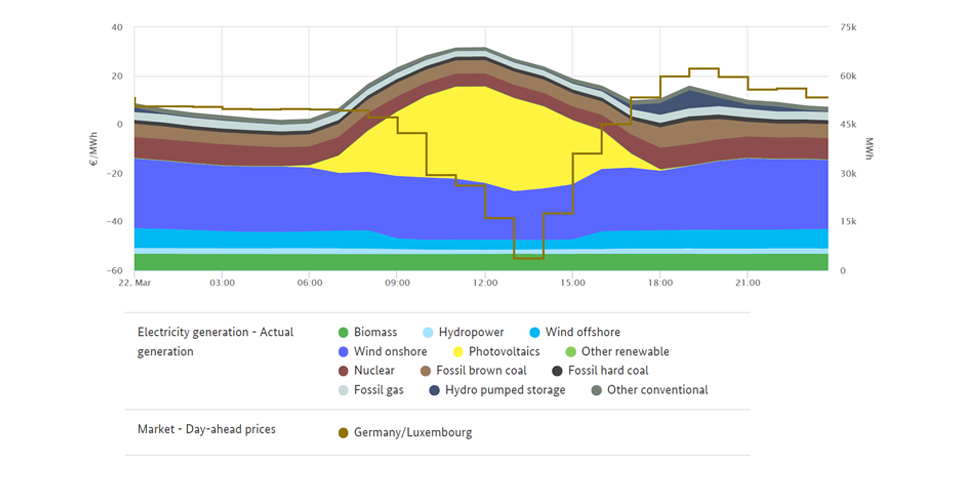
On Sunday 22 March, photovoltaic systems provided 18.3% of the electricity consumed, the highest level recorded for any day in March in the past five years.
Photovoltaic generation reached its highest absolute level on Monday 23 March. At 227.7 GWh, it was also the highest level recorded for March in the past five years.
One particular reason for the high level of generation, in addition to the sunny weather, is the continued increase in photovoltaic capacity, with the installed generating capacity rising by around 24.7% since 2015.
The chart illustrates solar generation in March.
Wind output totalled 14.2 TWh, with 11.6 TWh from onshore and 2.6 TWh from offshore wind plants. This was 12.6% lower than in March 2019, despite an expansion in wind generation capacity. Wind levels in March dropped considerably after a very windy month of February and compared with the previous year.
The wholesale electricity price in Germany
Compared with the previous year, wholesale prices for electricity fell. In March, the hourly products on the EPEX Spot day-ahead market were traded at between minus 55.05 and plus 64.70 euros per megawatt hour (€/MWh), resulting in an average of €22.49/MWh. This was €8.14 lower than the average price a year earlier (March 2019: €30.63/MWh). The reasons for this include higher renewable output and a decrease of 1.2 TWh in electricity consumption.
The lowest exchange price of minus 55.05 euros per megawatt hour was recorded between 1pm and 2pm on Sunday 22 March. During this time, the total electricity consumption of 51.3 GWh was met completely by the higher level of renewable generation of 52.9 GWh. At the same time, conventional generation was low at 12.1 GWh.
Compared with the same month a year earlier, the number of hours with negative wholesale prices decreased from 46 to 41 of the 743 hours of trading.
Negative prices were recorded in 15 consecutive hours on Sunday 1 March. Negative prices were recorded in periods of seven consecutive hours on 15, 22 and 29 March, in addition to other individual hours in the month.
As a result, the "six-hour rule" took effect on a total of four days, meaning that larger new installations receiving payments under the Renewable Energy Sources Act (EEG) and selling electricity directly did not receive payment in these periods. Under the rule, if the day-ahead price on the electricity exchange is negative for a period of at least six consecutive hours, the installation operators do not receive the market premium as from the first hour in the period with negative prices. In March 2019, the rule took effect three times.
On the day-ahead market, the highest price of the past month of €64.70/MWh was recorded on Wednesday 4 March between 6pm and 7pm. In this hour, electricity consumption was high at 67.4 GWh and there was a low level of generation from renewables. The electricity market reacts to this kind of situation by taking power from storage facilities (such as pumped storage stations), reducing the consumption of flexible loads and increasing the use of conventional power stations with higher marginal costs, in particular gas-fired power plants.
Wholesale prices in Germany | ||
| March 2020 | March 2019 |
Average [€/MWh] | 22.49 | 30.63 |
Minimum [€/MWh] | -55.05 | -23.04 |
Maximum [€/MWh] | 64.70 | 60.73 |
Number of hours with negative prices | 41 | 46 |
Data basis: smard.de
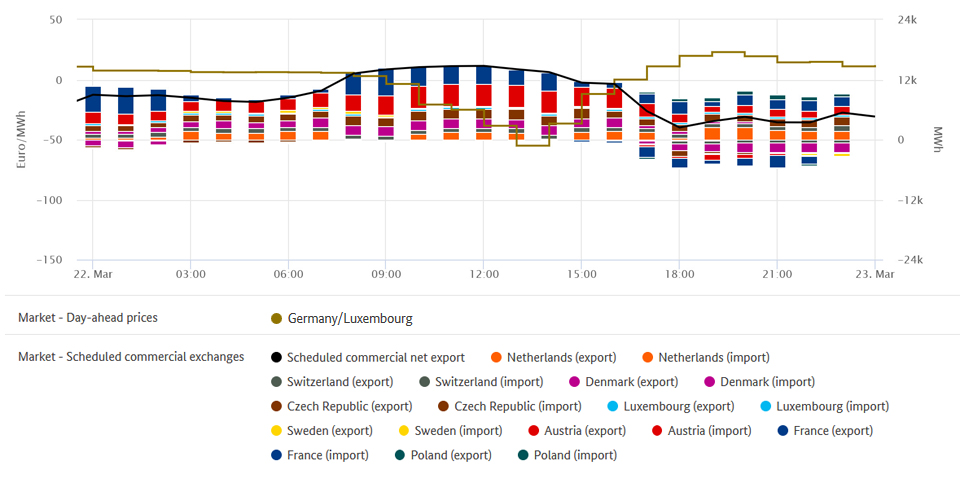
Commercial foreign trade
Germany's commercial net exports for March totalled 2.2 TWh, which is 5.1% of all the electricity produced in Germany in the month. In comparison with the previous year, net exports fell by 59.3%. The main customer for Germany's net exports of electricity (exports less imports) was Austria, which accounted for 1,985 GWh (up 0.7% compared with the previous year). Czechia followed in second place with 564 GWh (up 217%), ahead of Luxembourg with 313 GWh (down 12%).
One reason for the large increase in exports to Czechia was the number of hours in which electricity from Germany was cheaper. This was the case in 507 of the 743 hours of trading. In March 2019, electricity from Germany was cheaper than in Czechia in only 407 of the 743 hours of trading.
Germany was a net importer from Denmark, Sweden and France, from which it took a total of 667 GWh, 281 GWh and 32 GWh respectively. This represents an increase of 41%, 727% and 97% respectively.
One reason for the large rise of 727% in imports from Sweden was the electricity price, which was mostly lower in Sweden. The prices in Sweden were lower than Germany's prices in 517 out of 743 hours. In March 2019, this was the case in only 189 hours.
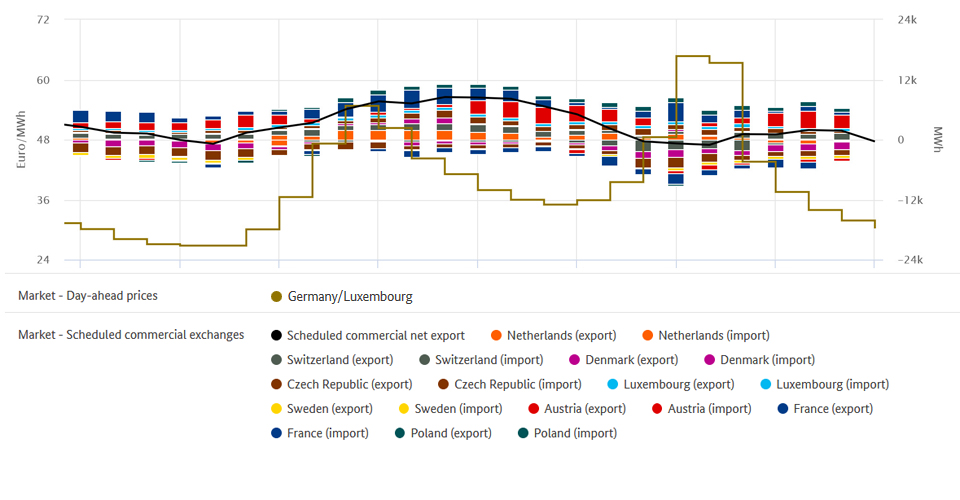
The chart gives an overview of Germany's commercial electricity trade. (Gross) exports are shown above the zero line while (gross) imports are shown below the zero line.
Changes in imports and exports are the result of frequent price fluctuations, which reflect the interaction of supply and demand in the respective countries and across borders. These fluctuations are part of normal market activity in the European wholesale electricity trade.
Market data graphs gallery