Hint: This website is not optimized for your browser version.
Electricity market topics
The electricity market in 2022
2 January 2023 – Electricity consumption fell by 4.1% in 2022 as a whole, with the greater decrease in the second half of the year. Generation from conventional energy sources was down 5.7% while generation from renewables increased noticeably, by 8.6%. The average wholesale electricity price was far higher than the previous year at €235.45/MWh (+143.1%). Germany also exported more electricity in net terms than the year before.
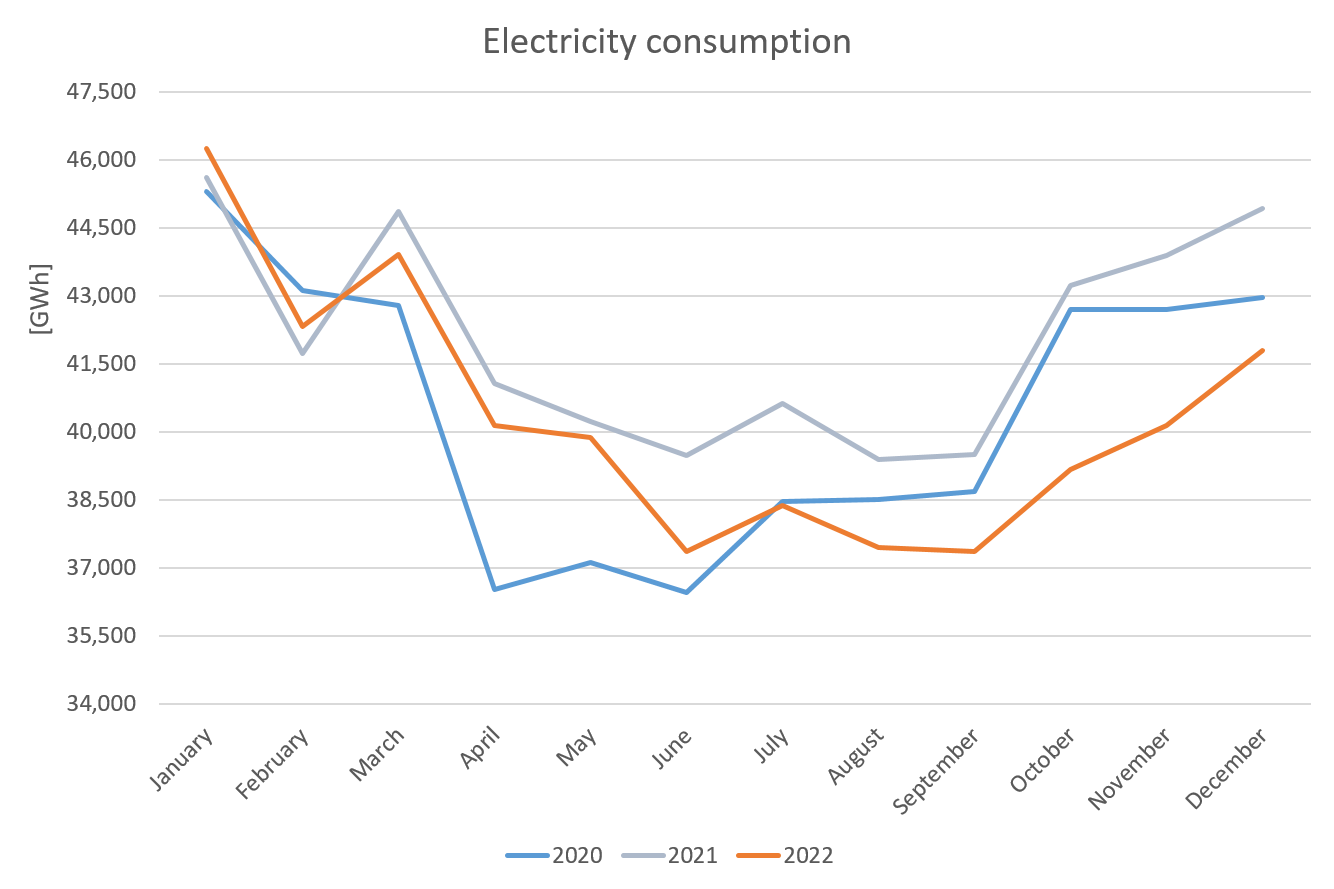
Electricity consumption fell to 2020 level
Electricity consumption (grid load*) was slightly higher than in 2021 at the beginning of 2022 but in the following months it fell and dropped off particularly strongly from June onwards. The biggest decline was recorded in October (-10.8%). In the course of the first six months, consumption approached 2020 levels and in the second half of the year it was at times considerably lower.
Overall, electricity consumption fell from 504.5 TWh in 2021 to 483.9 TWh in 2022 (-4.1%).
Conventional share of total generation lower
Germany's total electricity generation rose 0.4% to 507.1 TWh in 2022 (2021: 505.0 TWh). Despite the return of coal power stations to the electricity market, electricity generation from conventional energy sources was down 5.7% year-on-year, although it was higher in the second half-year than in the first (+7.1%). The greatest reduction was in nuclear power, which was down 49.8% because of the decommissioning of individual plants at the end of 2021. The second-largest decrease was from other conventional sources (-24.7%), but these only make up a small proportion of total generation.
Electricity generated by gas power plants rose 2.1%
Electricity produced from natural gas rose 2.1% year-on-year. There were several factors contributing to the continued use of natural gas to generate electricity despite the war in Ukraine and the reduction, or cessation, of Russian gas supplies.
One reason for the use of gas power plants is their flexibility. They can be switched off and fired up again much faster than coal or nuclear plants, which offers advantages if higher demand for electricity needs to be met at short notice. The great flexibility of gas power plants can be seen in their feed-in time series.
Gas-fired power plants can also be helpful, and in some cases essential, for redispatching and balancing.
Natural gas is used to generate process and district heat and, for technical reasons, electricity is often produced at the same time. From the operators' perspective, it makes sense for combined heat and power (CHP) plants to continue producing electricity if they are responsible for supplying heat to an urban or industrial heating network and if it is not yet possible – or would be more expensive – to separate the heat generation from the electricity generation process.
Long-term gas purchasing agreements, in which the gas had to be used in gas-fired power plants or paid for anyway even if it was not taken, also led to economic incentives to use gas in electricity production in the past. Amendments to the Energy Industry Act (EnWG) have removed these restrictions on use, permitting the gas to be injected into storage as well.
Since the Russian invasion of Ukraine, there have been huge wholesale price increases for gas and subsequently for electricity. The legislature has responded by making it possible for coal-fired plants to be brought back to the electricity market. Increasing the electricity supply on the market through the use of coal plants is intended to ensure that less electricity is generated by gas power plants. Overall, generation from lignite was 5.4% higher and generation from hard coal 21.3% higher than the previous year.
Generation from pumped storage stations was 21.6% higher in 2022 than the year before. Pumped storage involves electrical energy initially being used to pump water from a lower reservoir to an upper reservoir. The amount of energy used is also referred to as "electricity consumed in pumping" and is shown on the SMARD website.
The water can be released later back to the lower reservoir, driving turbines to create electricity. As the generation was higher, it follows that the electricity consumed in pumping was also higher (26.8%).
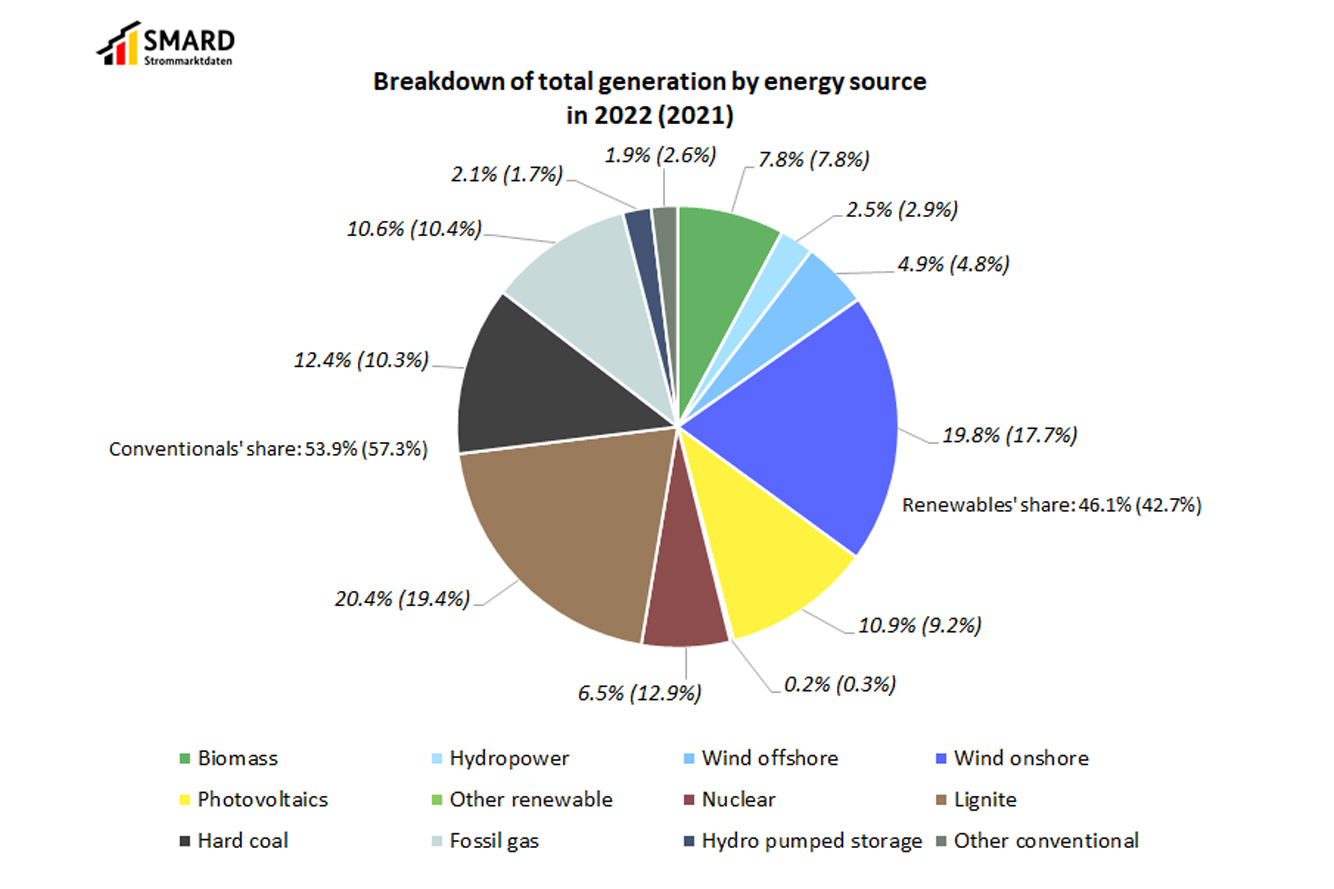
Renewables generation up 8.6%
Generation from renewable sources was 8.6% higher year-on-year in 2022. With an increase of 18.7%, photovoltaic installations saw the biggest rise. Their generation kept breaking records throughout the year, partly due to the at times very favourable weather conditions and partly due to the increase in installed generating capacity, which reached 57.7 GW from 53.3 GW.
A unusual occurrence affected solar generation on 25 October 2022. There was a sharp drop in the generation data showing the duration of a partial eclipse of the sun. It had already been taken into account in the forecast data the day before.
Wind generation was higher during the year, too, with increases of 12.5% and 3.1% for onshore and offshore turbines respectively. In this case, it was mainly the weather that led to the higher figures.
Hydropower generation was 14.4% lower and other renewables also generated 21.0% less in absolute terms as in both cases there was a reduction in installed generating capacity.
Renewables covered a total of 48.4% of electricity consumption (grid load*) in 2022 (2021: 42.7%).
Increase in wholesale prices
Day-ahead wholesale prices for electricity had started rising in September 2021. This trend continued over the turn of the year 2021/2022 and intensified following Russia's invasion of Ukraine because since then prices for gas and coal have been considerably higher too. Electricity prices have been extremely volatile and closely connected to gas price trends, which in turn have been highly dependent on developments in the Ukraine crisis and Russia's steps to escalate it with regard to supplying gas to Germany and Europe. However, market reactions were not always rational and supported by sound fundamental data. The actual cost benefit of gas power plants – because of the fact that they need fewer carbon allowances – was outweighed by the high cost of gas. As gas power plants tended to set the price in the merit order, the result was higher wholesale electricity prices.
The average price was over €300/MWh in both July and September. In August, it actually reached €465.18/MWh. The average price started falling again as of October 2022, as can be seen in the chart below.
The reason for the drop in price was the electricity consumption level, which was low for October and down 10.8% year-on-year. At the same time, renewables took a large share of total generation and correspondingly accounted for 49.5% of consumption. Moreover, in the last quarter of the year some coal power stations returned to the market, increasing generating capacity and thus the supply on the wholesale electricity market. Generating costs for gas power plants were also lower in October after natural gas prices had fallen.
Negative prices occurred much less often last year and only pulled the average down slightly. The average wholesale electricity price for the year as a whole was €235.45/MWh, which was more than double that of 2021 (€96.85/MWh). The average price in Germany's neighbouring countries was €228.37/MWh (2021: €96.13/MWh).
German day-ahead wholesale electricity price | ||
2022 | 2021 | |
Average [€/MWh] | 235.45 | 96.85 |
Minimum [€/MWh] | -19.04 | -69.00 |
Maximum [€/MWh] | 871.00 | 620.00 |
Number of hours with negative prices | 69 | 139 |
The highest day-ahead wholesale electricity price was €871.00/MWh between 7pm and 8pm on Monday 29 August. At that time, electricity consumption (grid load) was 56.0 GWh, coinciding with a low level of renewable generation (11.6 GWh) and a high level of conventional generation (43.2 GWh). Germany then exported 3.2 GWh to other countries, 2.3 GWh to France. At the same time, it imported 8.5 GWh, mainly from Norway, Denmark, Switzerland and the Netherlands, resulting in 5.3 GWh of net imports.
The lowest wholesale price was recorded between 1pm and 2pm on Sunday 20 March and was negative €19.04/MWh. During this hour, the vast majority of electricity consumption (grid load) of 53.8 GWh was met by renewables with a generation of 53.3 GWh. Germany exported 15.0 GWh net in the hour, primarily to Austria (3.1 GWh), Denmark (3.0 GWh) and France (2.4 GWh).
There is an interaction between supply and demand across the whole of Europe. Electricity is produced within Europe wherever it is cheapest. When Germany imports electricity, it benefits from the more favourable conditions for generation in other countries, and vice versa. The respective countries' wholesale prices on the day-ahead market are the result of this interplay.
Flow-based market coupling was extended to more countries last year to make more efficient use of transmission capacity. The flow-based capacity calculation methodology maximises welfare benefits. It was introduced for some country borders in May 2015 and is now being expanded to the whole Core Capacity Calculation Region (Core CCR) in central Europe. Further information about the change is provided here.
Net exports higher than previous year
Germany was a net exporter in commercial foreign trade** in 2022. While imports fell from 39.60 TWh the previous year to 35.76 TWh, exports rose from 56.99 TWh to 62.05 TWh. Net exports, therefore, were 26.29 TWh and 8.90 TWh higher than in 2021.
Germany was a net exporter of electricity to:
• Austria, with 16.04 TWh (2021: 18.45 TWh)
• France, with 15.3 TWh (2021: 6.48 TWh)
• Switzerland, with 6.60 TWh (2021: 1.79 TWh)
• Luxembourg, with 3.89 TWh (2021: 3.94 TWh)
• Czechia, with 1.65 TWh (2021: 0.23 TWh)
• Belgium, with 1.31 TWh (2021: 0.78 TWh)
Germany was a net importer of electricity from:
• Denmark 1, with 7.32 TWh (2021: 7.21 TWh)
• Norway, with 3.73 TWh (2021: 3.16 TWh)
• Sweden, with 3.14 TWh (2021: 1.98 TWh)
• Denmark 2, with 2.97 TWh (2021: 1.80 TWh)
• Poland, with 0.96 TWh (2021: 1.76 TWh)
• the Netherlands, with 0.37 TWh (2021: net export of 1.63 TWh)
Net exports to France, which were more than twice as high as the previous year, were in particular due to the unavailability of power stations in France. Maintenance and repairs had to be carried out on various nuclear power plants there, leading to downtimes, some of which were unplanned. The dry summer exacerbated the situation, with low river levels causing problems with cooling. France's total electricity generation in 2022 was down 14.9% to 439.9 TWh, while its consumption was 443.1 TWh (source: ENTSO-E). The country therefore had to import electricity to meet its demand. With an average wholesale price of €275.88/MWh, it also made economic sense to buy electricity from other countries.
__________________________________________________________________________
*The grid load share of electricity that was generated from renewables is calculated differently from the federal government’s target definitions for the expansion of renewable energy under the Renewable Energy Sources Act (EEG), where the basis for calculation is gross electricity consumption. The grid load does not include power stations' own consumption or industrial networks, so the calculation basis applied here – compared with the share of gross electricity consumption – typically results in a higher proportion of generation from renewables. The grid load is calculated by taking the net electricity generation, subtracting transmission capacity exports, adding transmission capacity imports and subtracting the pumping work at pumped storage power stations.
**The commercial foreign trade data used in this article that were determined by the results of electricity trading show the planned imports and exports. The imports and exports result from the sum of all volumes of electricity used or nominated in electricity trading from/to adjacent countries in the interconnected system (referred to as exchange schedules). The net export results from the balance of imports and exports. To calculate the costs and revenue, the imports and exports were offset against the hourly day-ahead prices on SMARD.
The figures presented in the charts and in the text may be updated at a later date. Data in article last updated on 18 January 2023. Further information about possible updates and data definitions is available in the user guide.
