Hint: This website is not optimized for your browser version.
Introducing the "Market data visuals" section
In this section, you can adjust the visuals by changing the order, region, time period and resolution as you wish so as to look at the data, which are presented in near real time.

As well as providing explanatory articles and regular analyses of various electricity market data, the SMARD platform also enables you to compile all available data in the form of a chart or table. Data from different categories can be presented, customised and exported in the Market data visuals section.
In this section, you can follow the development of the various data categories since 2015 in near real time. The chart shown can be customised by region, time period and resolution. You can also use drag and drop to change the order of the components in the chart. To do this, click on the individual components, hold down the mouse button and drag them to wherever you want.
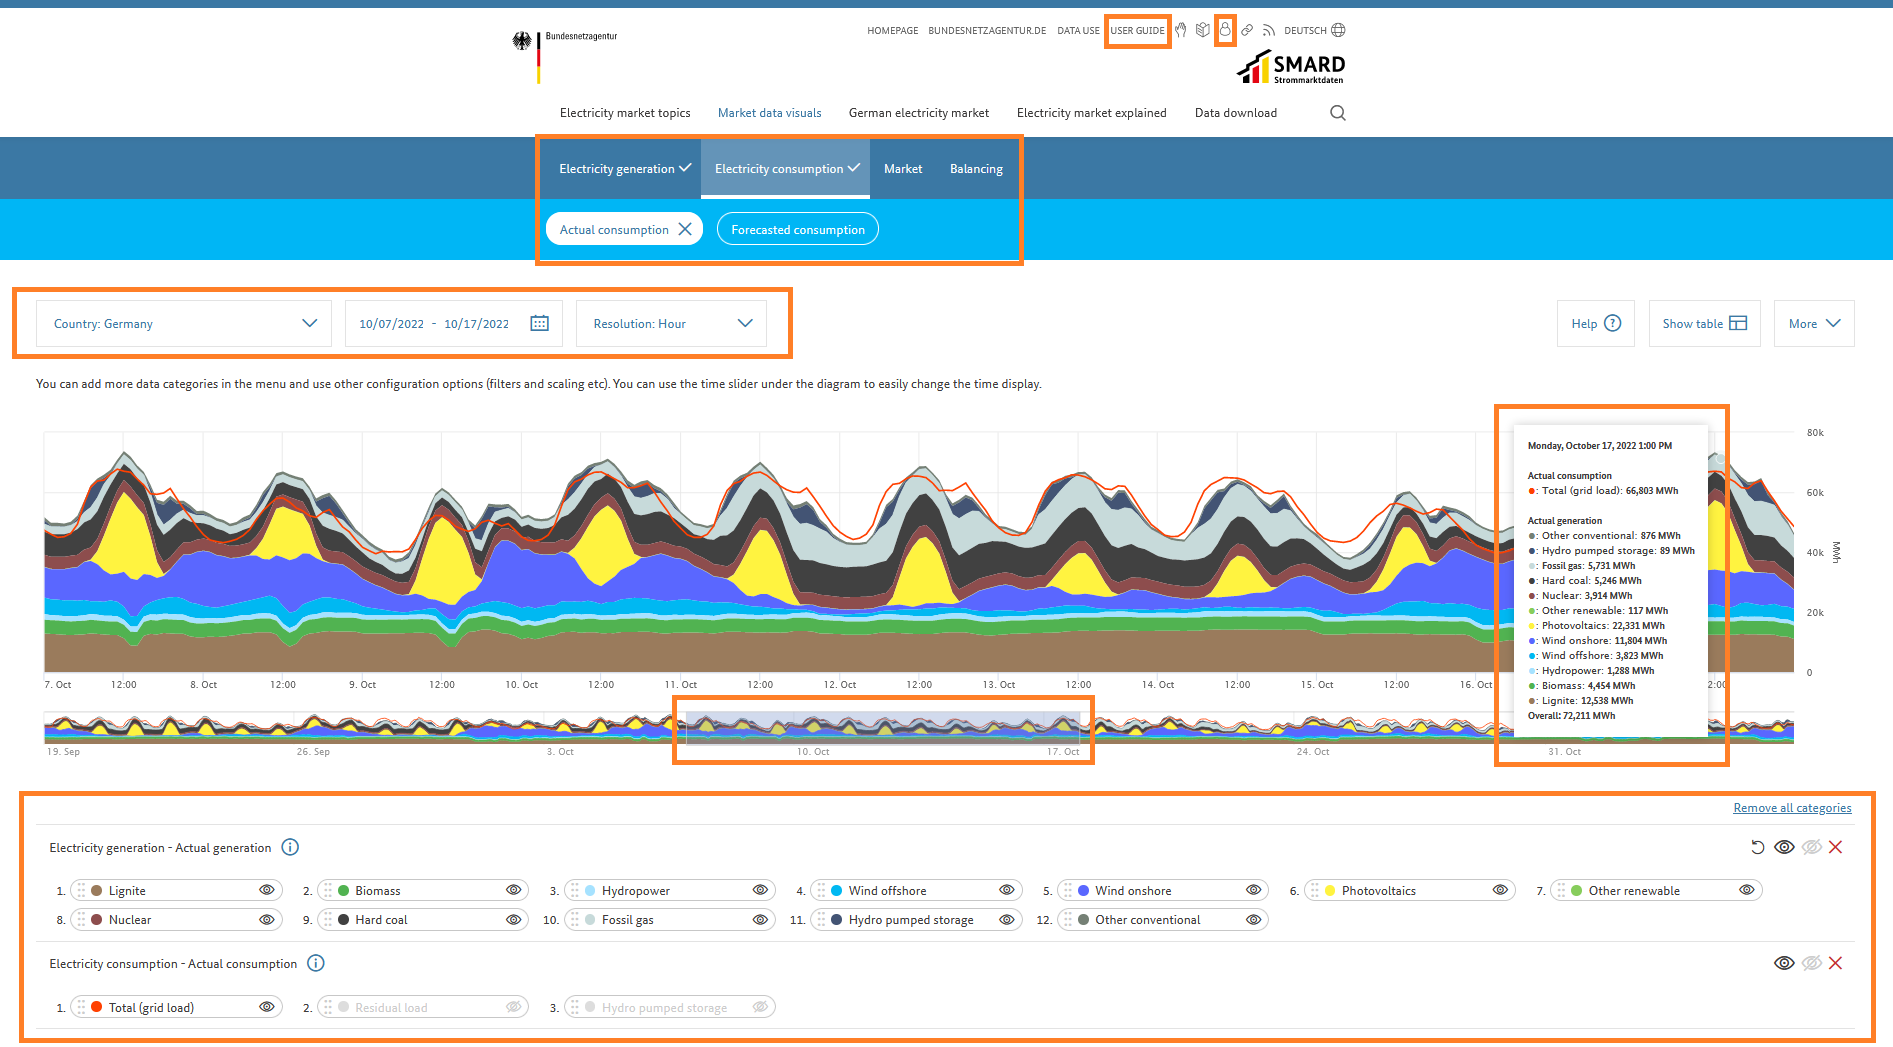
You can choose between the main categories such as electricity generation, consumption, market and balancing and several subcategories and can therefore analyse and answer various questions yourself. For example, by using the combined filter you can show data on actual generation and consumption for the same period and region so that these can be compared. Underneath the chart there is a preview of the chart with your settings for a different time period. You can move the shaded bar under the chart by clicking and holding down the left mouse button to view the data for a different period.
If you hover the mouse over the chart, you can also see the exact figures for the period shown. The components, such as the different energy sources, can also be deselected and individually selected in the legend. If they are deselected, they are no longer shown in the customised chart. You can also change the order of the components in the legend at the click of a mouse to, for example, show less volatile energy sources first in the chart.
The charts created and the underlying data in table form can be downloaded, shared or saved in your user account by clicking on the "more" button.
The "help" button leads to an interactive guide that explains how the customised visuals work. You can also find a detailed explanation of making a chart in section C of the User guide.