Hint: This website is not optimized for your browser version.
New on SMARD: customising the order of data displayed
You can now change the order in which data are displayed in charts and tables in the "Market data visuals" section.
You can view developments on the electricity market in near real time in the Market data visuals section using various data categories. You can customise the data displayed in a chart or table by combining two or more data categories, selecting and deselecting individual components, and selecting different regions, time periods and resolutions.
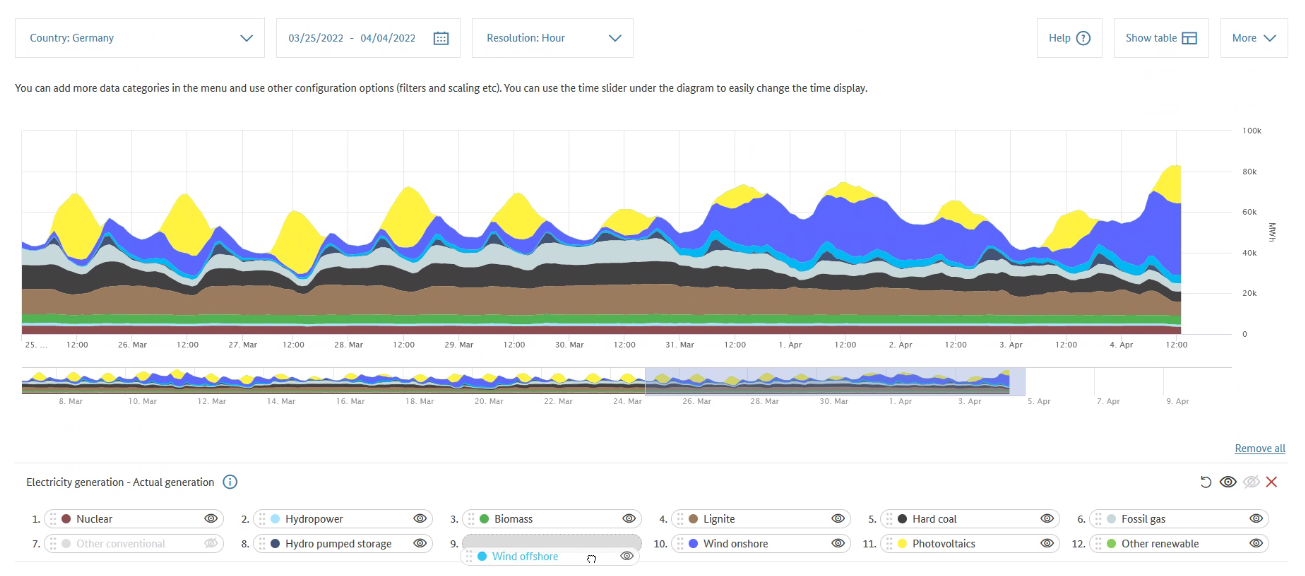
Up until now, it has not been possible to change the order in which the individual components in a data category are displayed in a chart or table. For example, the order of the components in the "Actual generation" data category is based on the statutory priority dispatch for renewable energy sources and on the volatility of each energy source. The renewable energy sources are therefore displayed at the bottom of a chart (or in the first column(s) of a table) and all the other energy sources are displayed above (or to the right). This is still how the data are initially displayed.
Now there is a new drag and drop function in the Market data visuals section that lets you change the order of the components and display them however you like: just click on the component you want to move, hold down the mouse button and drag it to wherever you want.
You can do this with both charts and tables and with both the desktop and the mobile version. You can change the order in a table by using the drag and drop function on the components listed below the table. If you have changed the order of the components and want to go back to the original order, you can just click on the round arrow on the right of the list.
Up until now, you could deselect a component by clicking it, and the name and the dot would be shown in light grey. Selecting and deselecting components is now easier using the eye icon. You can deselect a component by clicking the eye icon next to the component name; the icon will be crossed out and the component will not be displayed. You can also select and deselect all the components together by clicking the eye icon on the right above the list of components. It is quite simple really: an (open) eye means a component is visible and a crossed-out (closed) eye means a component is not visible. You can deselect a whole data category by clicking the red X on the right.
You can save customised charts in a user account and access them again later without having to re-configure them. This is useful if, for instance, you want to display different categories/components and/or have a different order for different market areas.
We are continually working on regular updates and new functions for our SMARD website, especially in response to the suggestions we receive via our feedback form, email and Twitter. Your suggestions are very welcome and help us in developing new functions.
