Hint: This website is not optimized for your browser version.
Net import increase - Electricity generation and electricity trading in May 2020
10 June 2020 – Compared with the same month of the previous year, electricity generation and electricity consumption in Germany were down 12.7% and11.5% respectively. The average wholesale price was €17.60/MWh, which was lower than the average price in the same month of the previous year. In May, Germany imported 2,079 GWh more electricity than it exported, making it an overall net importer.
Electricity generation, consumption and trading, as with almost all areas of public life and the economy, were affected by the restrictions introduced in mid-March by the federal government and the federal state governments to curb the spread of COVID-19. Compared with April, electricity consumption in May remained nearly unchanged (-0.4%), although compared with May of the previous year, it declined by 11.5%.
Electricity generation from renewable and conventional energy sources totalled 35.0 TWh in May (2019: 40.0 TWh). Generation from conventional sources was 25.5% lower than in May 2019, while generation from renewable sources was 2.4% higher year-on-year.
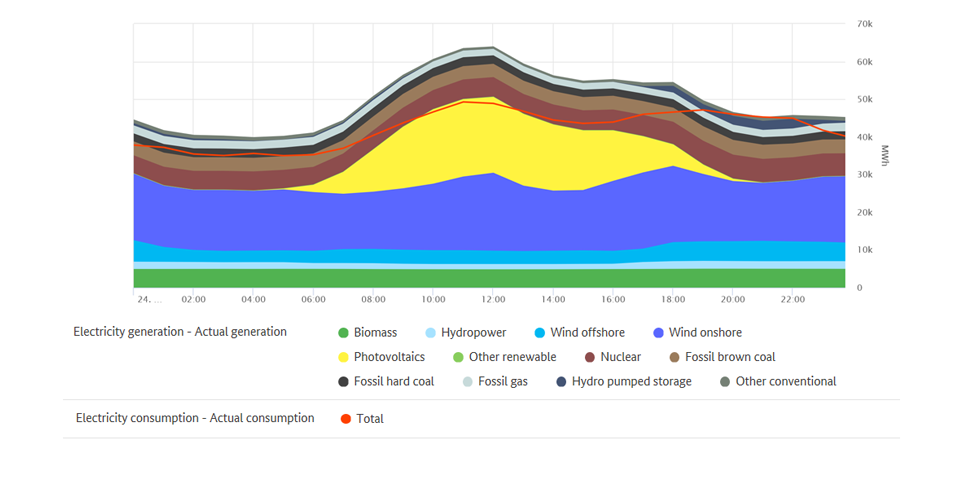
The chart illustrates electricity generation and consumption in Germany in the month of May.
The decrease in electricity generation from conventional sources was mainly due to the reduced usage of lignite (-50%) and hard coal (-55%). Electricity generation from nuclear power also decreased (-7%). Output from natural gas plants, on the other hand, increased by 22% compared with the same month of the previous year.
Possible reasons for the lower electricity generation from conventional sources are the increased electricity production from renewable sources and the decrease in electricity consumption during the coronavirus pandemic. There are also other factors in individual plant dispatch planning in the European electricity market, for example fuel costs or CO2 certificate prices, which impact the relative costs of a country’s fossil electricity generation. Changes in the installed and available capacity are also not negligible.
The decrease in usage of lignite to generate electricity can be explained by the transitioning of power generation units into security standby. Also, natural gas plants that emit less CO2 than coal-fired plants can benefit from the currently low fuel prices. At certain times, what is known as the “fuel switch” takes effect. This is when gas-fired plants take the place of coal-fired plants in the merit order and set the prices in the wholesale market.
One reason, among others, for the reduced electricity generation from nuclear power is the overhauling of the nuclear power plants Grohnde and Emsland. Also, the Philippsburg 2 nuclear power plant was still generating electricity in May 2019 and has since been decommissioned.
On Monday, 18 May, between 1pm and 2pm, when electricity consumption was high at 57.4 GWh, total electricity generation reached its maximum of just under 66.6 GWh, which was 11% beneath the maximum value in the same month a year earlier. Electricity generation recorded its lowest level of 26.7 GWh on Ascension Day, 21 May between 5am and 6am, when electricity consumption was low at 36.0 GWh.
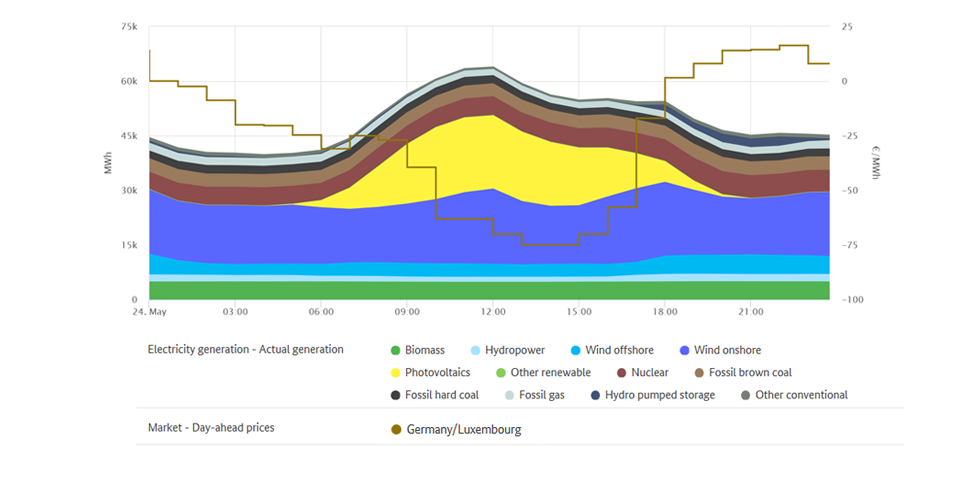
Highest and lowest outputs of renewable electricity generation
Electricity generation from renewable energy sources reached its highest level of 50.5 GWh on Sunday, 24 May between 12pm and 1pm. Photovoltaic systems generated 20.1 GWh (40%), onshore wind farms 20.7 GWh (41%), and offshore wind farms 3.5 GWh (7%). The remaining 6.2 GWh (12%) came from biomass, hydropower and other renewables. Electricity consumption during this hour was at 48.9 GWh. Generation from renewable sources fell to its lowest level of 8.0 GWh on Wednesday, 27 May between 3am and 4am, when electricity consumption was low at 39.4 GWh. With 4.7 GWh, biomass accounted for the majority (59%) among the renewables; hydropower generated was at 1.9 GWh (24%); on and offshore wind farms together generated only 1.3 GWh (16%); photovoltaic systems and other renewables generated 0.1 GWh (1%).
The graph shows the day when renewable electricity generation was at its highest. The red line shows consumption.
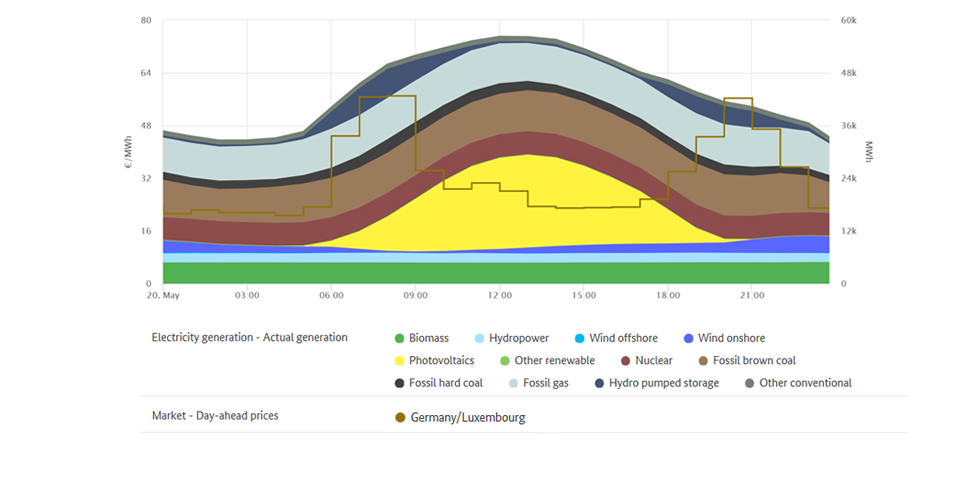
The wholesale electricity price in Germany
Compared with the previous year, wholesale prices for electricity fell. In May, the hourly products on the EPEX Spot day-ahead market were traded at between minus 74.97 and plus 57.00 euros per megawatt hour (€/MWh), resulting in an average of €17.60/MWh. This was €20.24 lower than the average price a year earlier (May 2019: €37.84/MWh). The reasons for this include higher renewable output and a decrease of 11.5% (-4.7 TWh) in electricity consumption during the coronavirus pandemic. A large number of negative prices also resulted in a lower average.
The lowest exchange price was recorded between 1pm and 2pm on Sunday, 24 May and was minus 74.97 euros per megawatt hour. During this time, the total electricity consumption of 46.8 GWh was met almost completely by the higher level of renewable generation of 46.0 GWh. At the same time, conventional generation was low at 13.3 GWh.
The number of hours with negative electricity prices was four times the amount compared with the same month a year earlier: it increased from 9 to 36 of the 744 total hours of trading.
Negative prices were recorded in 17 consecutive hours on Sunday, 24 May. The "six-hour rule" took effect on this day, meaning that larger new installations receiving payments under the Renewable Energy Sources Act (EEG) and selling electricity directly did not receive payment in these periods. Under the rule, if the day-ahead price on the electricity exchange is negative for a period of at least six consecutive hours, the installation operators do not receive the market premium as from the first hour in the period with negative prices.
On the day-ahead market, the highest price of the past month of €57.00/MWh was recorded on Wednesday, 20 May between 8am and 9am. In this hour, electricity consumption was high at 56.7 GWh and there was a low level of generation from renewables (15.2 GWh). The electricity market reacts to this kind of situation by taking power from storage facilities (such as pumped storage stations), reducing the consumption of flexible loads and increasing the use of conventional power stations.
Wholesale prices in Germany | ||
| May 2020 | May 2019 |
Average [€/MWh] | 17.60 | 37.84 |
Minimum [€/MWh] | -74.97 | -22.96 |
Maximum [€/MWh] | 57.00 | 68.61 |
Number of hours with negative prices | 36 | 9 |
Data basis: smard.de
Commercial foreign trade
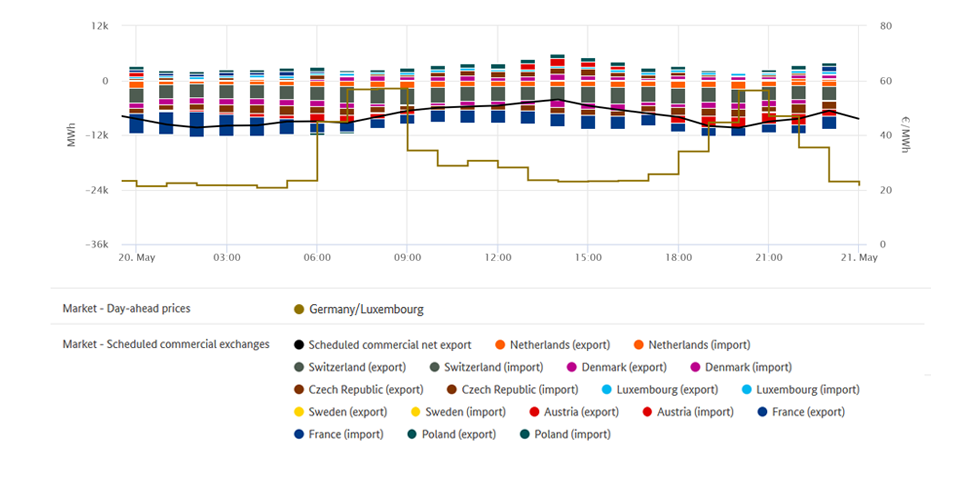
Germany’s commercial net exports for May fell significantly compared with the same month of the previous year. Germany imported a total of 2,079 GWh more electricity than it exported, making it an overall net importer, as was the case in April. In March, Germany exported 2,181 GWh more electricity than it imported.
Changes in imports and exports are the result of frequent price fluctuations, which reflect the interaction of supply and demand in the respective countries and across borders. These fluctuations are part of normal market activity in European wholesale electricity trading.
The change in the balance of trade may therefore be linked to non-availability of power stations, varying weather conditions (influencing the amount of energy from renewable sources), fluctuating prices for CO2 certificates (which directly influence the costs of electricity generated from fossil fuels) and varying demand for electricity. For example, consumption was lower in May 2020 than in the same month of the previous year due to the coronavirus crisis. But electricity generation in Germany dropped more strongly than electricity consumption so electricity had to be imported.
A total of 1.8 TWh were exported, which corresponds to 5.1% of the electricity that was produced in this time frame in Germany. The main customer for Germany's net exports of electricity (exports less imports) was Austria, which accounted for 888 GWh (down 7% compared with the previous year). Poland followed in second place with 386 GWh (up 223%), ahead of Luxembourg with 288 GWh (down 17%).
One reason for the large increase in exports to Poland was the number of hours in which electricity from Germany was cheaper. This was the case in 728 of the 744 hours of trading.
Germany was a net importer from France (1,389 GWh; 32% more imports compared with the previous year), Switzerland (1,249 GWh; up 286%), the Netherlands (725 GWh) and Denmark (468 GWh). Germany exported a net total of 197 GWh to the latter two countries in the same month in the previous year.
One reason for the rise in imports is the lower wholesale prices in the neighbouring countries compared to wholesale prices in Germany. Electricity consumption in France, for example, fell sharply compared to the same month in the previous year (-16%). The lower demand there caused the average wholesale price in France to drop as well, from €37.21/MWh to €14.86/MWh. Electricity was less expensive in France than in Germany for 387 of the 744 traded hours. In the previous year this was the case in only 150 hours.
Germany also imported a total of 24 GWh of electricity from Sweden (net import in May 2019: 92 GWh). However, this value only reflects the time frame from 29 - 31 May 2020 since the cable from Germany to Sweden (Baltic Cable) was not operational from 30 April to 28 May.
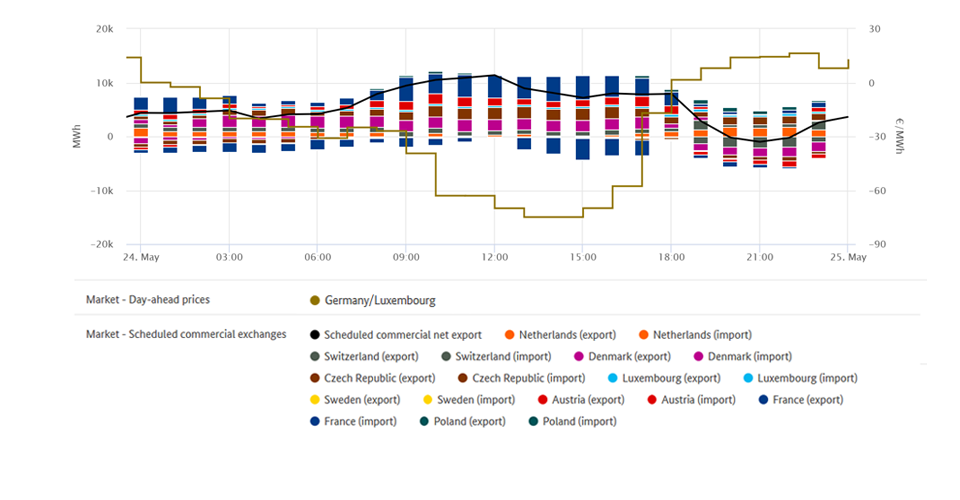
The chart gives an overview of Germany's commercial electricity trade. (Gross) exports are shown above the zero line while (gross) imports are shown below the zero line.
Market data graphs gallery