Hint: This website is not optimized for your browser version.
Wholesale prices up - Electricity generation and electricity trading in September 2020
12 October 2020 – Electricity generation and electricity consumption in Germany were down 1.5% and 1.2% respectively compared with the same month of the previous year. The average wholesale price was €43.69/MWh, which was higher than the average price in the same month of the previous year and also the highest so far this year. Overall, Germany was a net exporter this September.
Electricity generation from renewable and conventional energy sources totalled 39.2 TWh in September 2020 (2019: 39.8 TWh). While generation from conventional sources was 5.7% higher than in September 2019, generation from renewable sources was 10.7% lower. Electricity consumption in September totalled 37.9 TWh (2019: 38.3 TWh).
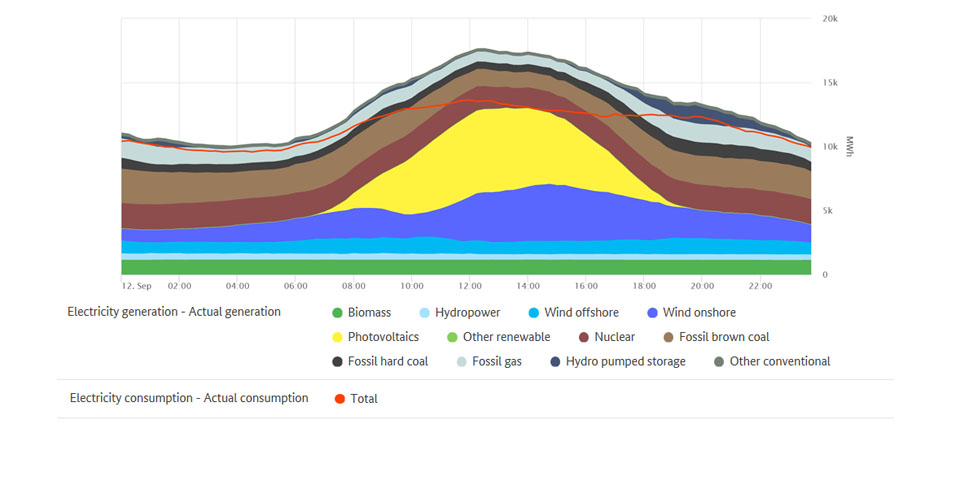
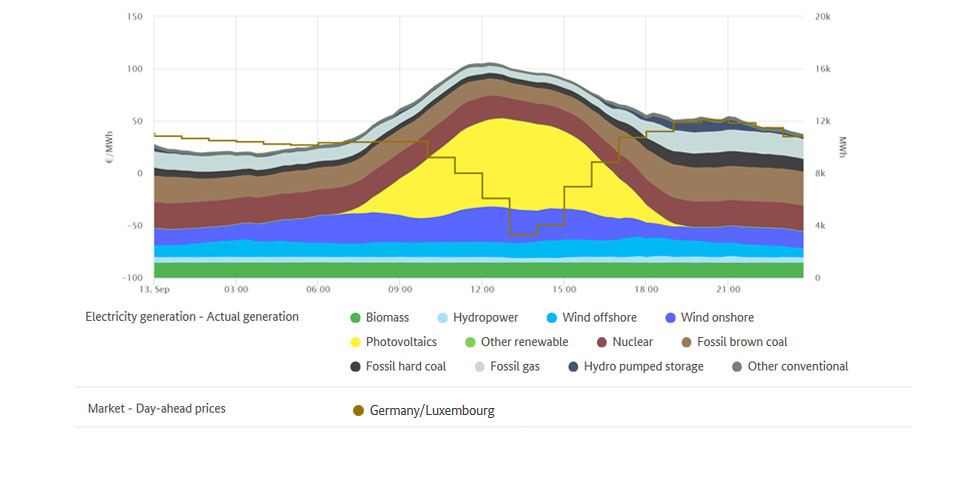
The chart illustrates electricity generation and consumption in Germany in the month of September.
Highest and lowest outputs of renewable electricity generation
Electricity generation from renewable energy sources reached its highest level of 51.8 GWh on Thursday 12 September between 1pm and 2pm, thereby accounting for around 75% of total generation. During this time, there was a high level of solar generation at 25.4 GWh (36.6%). Onshore wind farms generated a further 16.2 GWh (23.3%) and offshore wind farms 3.9 GWh (5.6%). The remaining 6.3 GWh (9%) came from biomass, hydropower and other renewables. During this time, electricity consumption was around 53 GWh. Renewables therefore covered 97.7% of the electricity consumption, ie grid load, during this hour.
Generation from renewable sources fell to its lowest level of 6.9 GWh on Tuesday 22 September between 5am and 6am, when electricity consumption was also low at 46.9 GWh. At 4.3 GWh, biomass accounted for the majority (62%) among the renewables; hydropower generated around 1.6 GWh (23%); onshore and offshore wind farms together generated 0.9 GWh (13%); and other renewables generated the remaining 0.1 GWh (2%).
Overall, electricity generation from renewables was 10.7% lower in September compared with the same month of the previous year. Lower wind levels led to a lower level of generation in particular among onshore wind farms, which generated 34.9% less compared with a year earlier. Generation among offshore wind farms was also down, in this case by 14.1%. In contrast, the sunny weather in September resulted in a year-on-year increase of 18.3% in solar generation. The total number of sunshine hours recorded was 206 hours, which was over a third more than that expected (150). In addition to favourable weather conditions, continuing expansion also plays a role in electricity generation from renewables.
The wholesale electricity price in Germany
Wholesale prices for electricity were higher compared to a year earlier. In September, the hourly products on the EPEX Spot day-ahead market were traded at between minus 58.80 and plus 200.04 euros per megawatt hour (€/MWh), resulting in an average price of €43.69/MWh. This was €7.94 higher than the average in the same month of the previous year (September 2019: €35.75/MWh) and was the highest so far this year. The higher monthly average was due to individual price peaks up to €200.04/MWh as well as the low wind generation output.
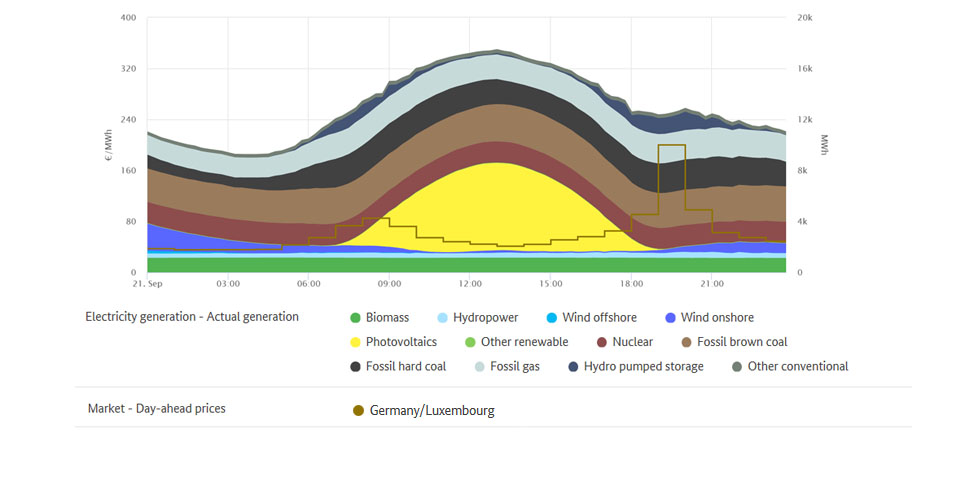
The chart illustrates actual electricity consumption and wholesale prices for electricity in September 2020.
The lowest exchange price was recorded between 1pm and 2pm on Sunday 13 September and was minus 58.80 euros per megawatt hour. During this time, the total electricity consumption of 48.3 GWh was met almost completely by the higher level of renewable generation of 47.8 GWh.
Negative electricity prices were recorded in 6 of the 727 hours of trading this September. In September 2019, this was the case in 15 hours.
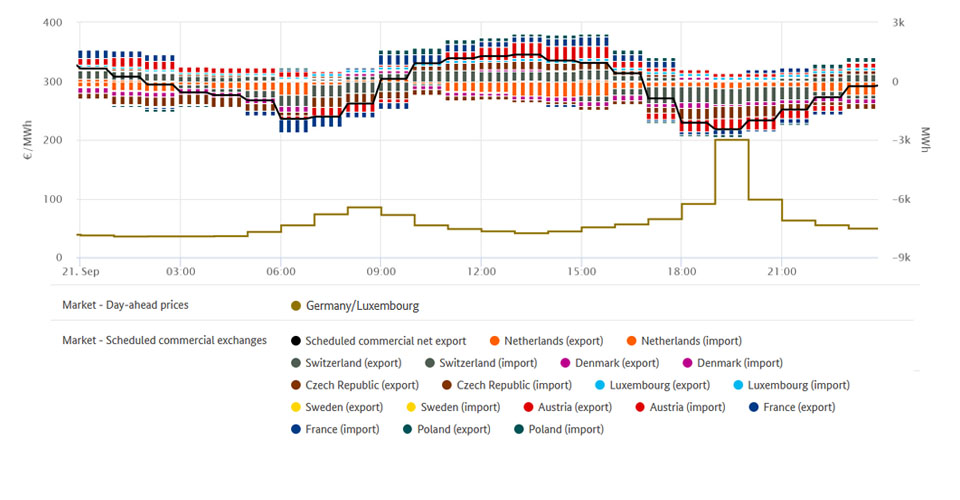
On the day-ahead market, the highest price of the past month of €200.04/MWh was recorded on Monday 21 September between 7pm and 8pm. This was the highest wholesale price since the introduction of the Germany/Luxembourg bidding zone in October 2018. The last time a higher price had been recorded was on 8 February 2012, when the price in the former single bidding zone consisting of Germany, Austria and Luxembourg reached €210/MWh. On 21 September between 7pm and 8pm, electricity consumption was high at 60.2 GWh and there was a low level of generation from renewables (7.4 GWh). This low level was due in particular to the lack of wind and consequent low level of generation by wind farms (1.2 GWh in total). Biomass generated 4.3 GWh, hydropower 1.6 GWh, and solar and other renewables 0.3 GWh. The electricity market reacts to this kind of situation by taking power from storage facilities (such as pumped storage stations), reducing the consumption of flexible loads and increasing the use of conventional power stations. In addition, several conventional power plants in Europe were undergoing annual inspection, which also contributed to the temporary, short-term increase in the price.
Wholesale prices in Germany | ||
September 2020 | September 2019 | |
Average [€/MWh] | 43.69 | 35.75 |
Minimum [€/MWh] | -58.80 | -37.29 |
Maximum [€/MWh] | 200.04 | 71.47 |
Number of hours with negative prices | 6 | 15 |
Data basis: smard.de
Commercial foreign trade
In total, Germany exported 1,005.2 GWh more electricity than it imported in September, making it an overall net exporter. It had also been a net exporter in September 2019, exporting 1,390.1 GWh. Net exports were therefore 27.7% down on the previous year.
The chart shows Germany's total net exports and imports to and from its neighbours.
Changes in imports and exports are the result of frequent price fluctuations and are part of normal market activity. They reflect the interaction of supply and demand throughout the whole of Europe. At what point in time electricity is imported or exported does not depend solely on supply and demand, but also on the electricity prices of the other countries. Wholesale prices determined as a part of market coupling result from what are known as the relative generation costs, which vary over time. Among other things, wholesale prices reflect the costs for fuels or C02 certificates, which in turn depend on other factors. Available transmission capacity at the national borders also plays a role. Details play a role particularly when small price differences on the electricity market lead to bigger changes such as the switch from a net import to a net export.
Germany was a net importer this month only from Denmark (545 GWh; 2019: 73 GWh), the Netherlands (227 GWh; 2019: 466 GWh) and Sweden (116 GWh; 2019: 53 GWh). One reason for the rise in imports from Denmark could be the number of hours in which electricity was less expensive in the Denmark 1 zone than in Germany. This was the case in 300 hours (2019: 137 hours).
In contrast, no electricity could be imported from or exported to the Denmark 2 zone because of maintenance work on the Kontek interconnector. In September 2019, net exports to the Denmark 2 zone totalled around 117 GWh.
The main customer for Germany's net exports of electricity (exports less imports) in September was France, which accounted for around 707 GWh. In September 2019, Germany imported 691 GWh more electricity from France than it exported.
One reason for this shift from net imports to net exports in the trading with France could be the higher number of hours in which electricity was less expensive in Germany. This was the case in 310 of the 727 hours of trading this September, compared to only 164 hours in September 2019. The low level of availability of nuclear power in France led to a marked year-on-year increase in the French average price to €47.20/MWh (2019: €35.54/MWh).
As in August, there was a large year-on-year decline in net exports to Austria, from 2,013 GWh in September 2019 to 570 GWh this September. One reason for this decrease could be the overall decline in Germany's exports to other countries. Another reason was that Austria's electricity generation was 9.7% higher than in the same month of the previous year, while electricity consumption was down time by 4.5%. The share of energy consumption (the grid load) covered by renewables increased in Austria from 61.9% in September 2019 to 80.4% this September. Hydropower accounted for the majority at 65.6%, compared to 46.7% last September.
The chart gives an overview of Germany's commercial electricity trade. (Gross) exports are shown above the zero line while (gross) imports are shown below the zero line.
Market data graphs gallery