Hint: This website is not optimized for your browser version.
The electricity market in the second quarter of 2023
High feed-in from solar
20 July 2023 – The proportion of electricity generated from renewable sources in the second quarter of 2023 was 59.3%. Overall, electricity consumption was down 4.2% on the same quarter of last year. The average wholesale electricity price was €92.29/MWh, half the level of Q2 2022. In commercial foreign trade, Germany was a net importer.
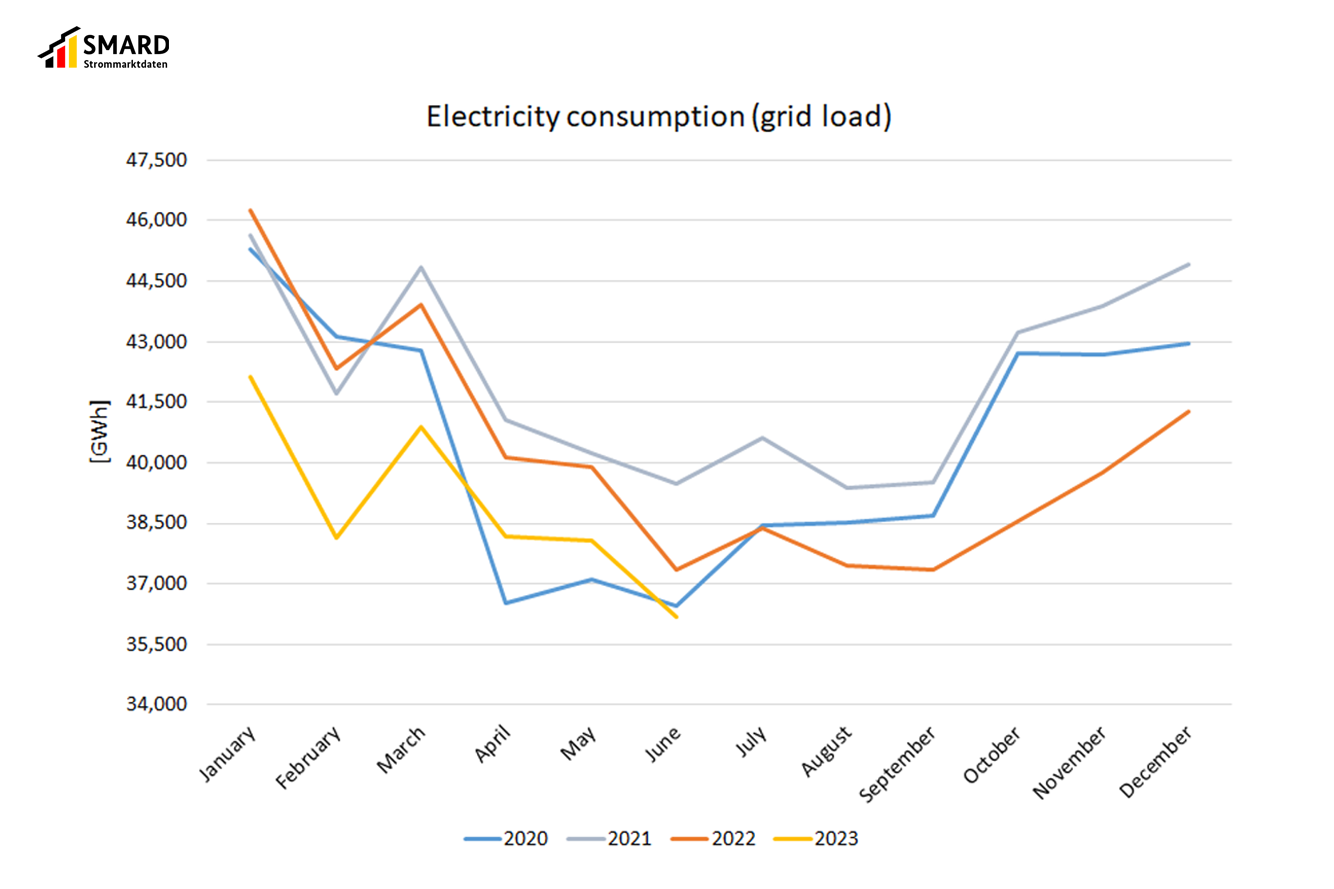
Electricity consumption falls again from previous quarters
Electricity consumption (grid load) continued its downward trend in the past quarter. It was 4.2% lower than in the same quarter of last year. The largest difference in the three-month period was in April.
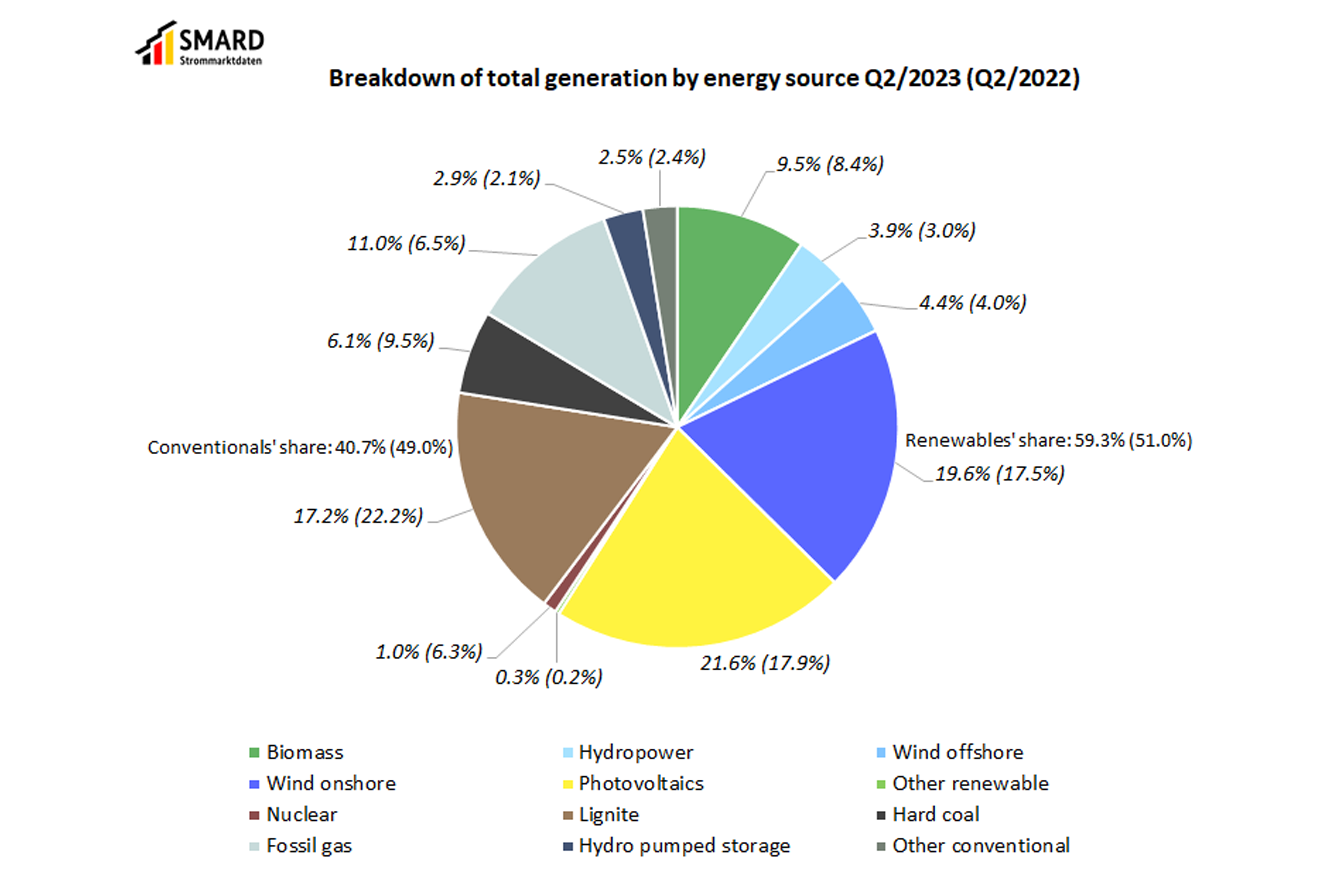
PV installations increased generation by 6.3%
Generation* from photovoltaic (PV) installations rose 6.3% year-on-year in the past three months. One reason for this was the addition of new installations. Installed generating capacity was up 4.5 GW year-on-year.* Another cause was the favourable weather conditions in recent months, with plenty of sun and not much rain, especially in June (Deutscher Wetterdienst). PV installations made the largest contribution among the renewables to total generation (21.6%).
Hydropower generation also increased by 14.4% from Q2 2022, possibly due to the very dry period in the previous year.
Generation from onshore and offshore wind decreased slightly from the same quarter of last year, by 1.9% and 1.3% respectively, while biomass was also 0.7% lower.
Overall, renewables' share of total generation* rose to 59.3%. They met 53.6% of electricity consumption (grid load). This high proportion was thanks both to higher generation and lower consumption.
Closure of the remaining nuclear power plants
The last three nuclear power plants in Germany were switched off in April. The gradual reduction in generation can be seen in the SMARD data broken by individual power plants. Their share of total generation in the second quarter was correspondingly small.
Coal generation saw a clear decrease too, with a decline of 31.6% for lignite and 43.8% for hard coal. The reason may have been lower demand leading to lower generation overall. There were also more instances of individual power stations on the electricity market being unavailable due to maintenance or repairs.
By contrast, pumped storage generation was up 21.3%. The 47.7% increase in the generating figures for natural gas was caused by changes in the way the four German transmission system operators (TSOs) report their data. The Bundesnetzagentur maintains close contact with the TSOs to improve the quality of their data reports, especially regarding the levels of coverage, which are listed in the SMARD user guide. As part of this process, data reports were updated. Three of the four TSOs revised their figures for past periods downwards. At the same time, the fourth TSO is recording much higher figures using the new measurement methodology. That has led to a jump in the gas generating figures for 2023 compared with 2022. A possible update to the past data in this case, too, is under consideration.
One reason for the continued use of gas power plants is their flexibility. They can be switched off and fired up again much faster than coal or nuclear plants, which offers advantages if higher demand for electricity needs to be met at short notice. Gas-fired power plants can also be helpful, and in some cases essential, for redispatching and balancing. The great flexibility of gas power plants can be seen in their feed-in time series.
Natural gas is used to generate process and district heat and, for technical reasons, electricity is often produced at the same time. From the operators' perspective, it makes sense for combined heat and power (CHP) plants to continue producing electricity if they are responsible for supplying heat to an urban or industrial heating network and if it is not yet possible, or would be more expensive, to separate the heat generation from the electricity generation process.
The changes in renewable and conventional energy sources led to a 12.2% drop in total generation in the second quarter of 2023 compared with 2022.
Average wholesale electricity price half that of Q2 2022
Following Russia's invasion of Ukraine, there was a huge increase in prices on the wholesale markets for electricity, gas and coal. Electricity prices were extremely volatile and closely connected to gas price trends.
The main reason for the higher prices for electricity over the year was the increase in natural gas prices that occurred in the second half of 2021. Natural gas power plants set the price for many hours in European wholesale electricity trading. The last quarter of 2022 then saw a decrease in electricity prices.
These reasons also led to widespread high prices in the second quarter of 2022. The highest price was €500/MWh and the average was €186.98/MWh.
The average price more than halved in the second quarter of 2023 to €92.29/MWh. This was partly due to the lower electricity consumption, as already mentioned, as well the high share of renewables in electricity generation. The highest price was €207.92, which was also less than half that of the same quarter last year. There were negative prices in 64 of the 2,184 hours of trading, bringing down the overall average price. In the second quarter of 2022, there had been only 24 hours of negative prices.
Moreover, in the last quarter of the year some coal power stations returned to the market, which increased generating capacity and thus the supply on the wholesale electricity market. Generating costs for gas power plants were also lower in October following a decrease in natural gas prices.
Day-ahead wholesale electricity prices in Germany | ||
Q2 2023 | Q2 2022 | |
Average [€/MWh] | 92.29 | 186.98 |
Minimum [€/MWh] | -129.96 | -13.85 |
Maximum [€/MWh] | 207.92 | 500.00 |
Number of hours with negative prices | 64 | 24 |
The highest price (€207.92/MWh) was recorded on Monday 5 April between 7am and 8am. Generation from conventional energy sources made up 46.1 GWh of the total 56.4 GWh in that hour, leading to the price peak, which was also higher than the average price in Germany's neighbouring countries (€199.22/MWh).
The lowest price of minus €129.96/MWh was recorded on Sunday 28 May between 2pm and 3pm. During that time, renewable energy generation was 43.7 GWh, covering almost all the consumption of 43.9 GWh. There were negative prices in all countries with which electricity is traded except for the northern Italian market area and Poland. The lowest price, minus €400/MWh, was in the Netherlands.
Commercial foreign trade
In the second quarter of this year, Germany imported 7,993.7 GWh more electricity than it exported, making it a net importer. In Q2 2022, net exports had totalled 3,646.4 GWh.
There is an interaction between supply and demand across the whole of Europe. Electricity is produced within Europe wherever it is cheapest. Germany and the other European countries can all benefit from the most favourable conditions for generation in each case. The wholesale electricity prices and trading are the result of this interplay. As a result, there may be times when it makes sense to import or export electricity for economic, rather than supply-related, reasons. Network capacity and stability also play a role in trading flows.
The change in the direction of foreign trading in the second quarter was due to wholesale prices in other countries. The chart below shows the development of the average German wholesale electricity price and those of neighbouring countries and net exports in the past quarter.
In the aggregated chart above it can be seen that net exports were mostly down when the average price in neighbouring countries was lower but rose again when electricity in the other countries was more expensive than in Germany.
A look at the hourly day-ahead prices makes clear that electricity in the countries from which electricity was imported (net) was cheaper or the same price in many hours. In both cases, it can make economic sense to import electricity. Prices are often the same as in Germany in those countries that, like it, are part of the flow-based market coupling. This capacity calculation method leads to more efficient use of transmission capacity and an alignment of prices.
Germany was a net importer of electricity from:
- Denmark 1, with 2,473.0 GWh (Q2 2022: 1,470.7 GWh)
- Norway, with 1,303.5 GWh (Q2 2022: 1,083.1 GWh)
- France, with 1,272.7 GWh (Q2 2022: net exports of 1,937.5 GWh)
- Netherlands, with 1,131.7 GWh (Q2 2022: 428.6 GWh)
- Switzerland, with 702.6 GWh (Q2 2022: net exports of 1,653.2 GWh)
- Denmark 2, with 676.7 GWh (Q2 2022: 646.8 GWh)
- Sweden, with 670.7 GWh (Q2 2022: 683.3 GWh)
- Czechia, with 248.4 GWh (Q2 2022: net exports of 861.6 GWh)
- Belgium, with 240.3 GWh (Q2 2022: net exports of 37.0 GWh)
- Austria, with 92.4 GWh (Q2 2022: net exports of 3,126.5 GWh)
- Poland, with 24.3 GWh (Q2 2022: 588.0 GWh)
Germany was a net exporter of electricity to:
- Luxembourg, with 842.6 GWh (Q2 2022: 931.1 GWh)
_________________________________________________________________________________________________________________________
*The actual generation is the net electricity generation. It is the electricity fed into the general supply network less the electricity consumed by power plants themselves. It does not include electricity generated in the Deutsche Bahn network or within industrial networks and closed distribution networks.