Hint: This website is not optimized for your browser version.
High wind power output from storms - Electricity trading and electricity generation in February 2020
12 March 2020 – Electricity generation in Germany was down 0.7% compared with a year earlier. The average wholesale price was €21.92/MWh, which was lower than the average price in the same month a year earlier and the lowest in five years. Commercial net exports fell by 28%.
Electricity generation from renewable and conventional energy sources totalled 44.2 TWh in February (2019: 44.5 TWh). While generation from conventional sources was 35.4% lower than in February 2019, generation from renewable sources was 53.4% higher.
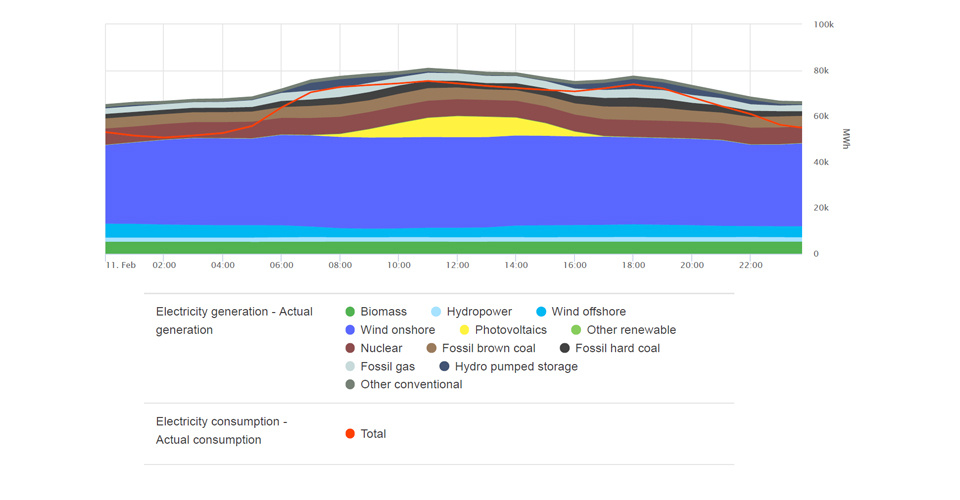
On Tuesday 11 February, between 11am and 12pm, total electricity generation reached its maximum of 80.6 GWh, which was 2.5% below the maximum value in the same month a year earlier. Electricity generation recorded its lowest level of 45.6 GWh on Sunday 2 February between 3pm and 4pm.
The chart illustrates electricity generation and consumption in Germany in the month of February.
Highest and lowest outputs of renewable electricity generation
Electricity generation from renewable energy sources reached its highest level of 59.7 GWh on Tuesday 11 February between 12pm and 1pm. Onshore wind farms generated 39.5 GWh (66.2%), offshore wind farms 4.2 GWh (7%), and photovoltaic systems 9.1 GWh (15.2%). The remaining 6.9 GWh came from biomass, hydropower and other renewables. Generation from renewable sources fell to its lowest level of 10.1 GWh on Friday 7 February between 5am and 6am.
High wind power output from storms
In February, generation from wind power stations was high. Wind output totalled 20.3 TWh, with 17.3 TWh from onshore and 3 TWh from offshore wind plants. This was nearly twice as much as the total wind output of 10.8 TWh in the same month a year earlier.
One of the reasons for the large increase was Storm Sabine. Wind output totalled 3.5 TWh in the five-day period from 7 to 11 February alone.
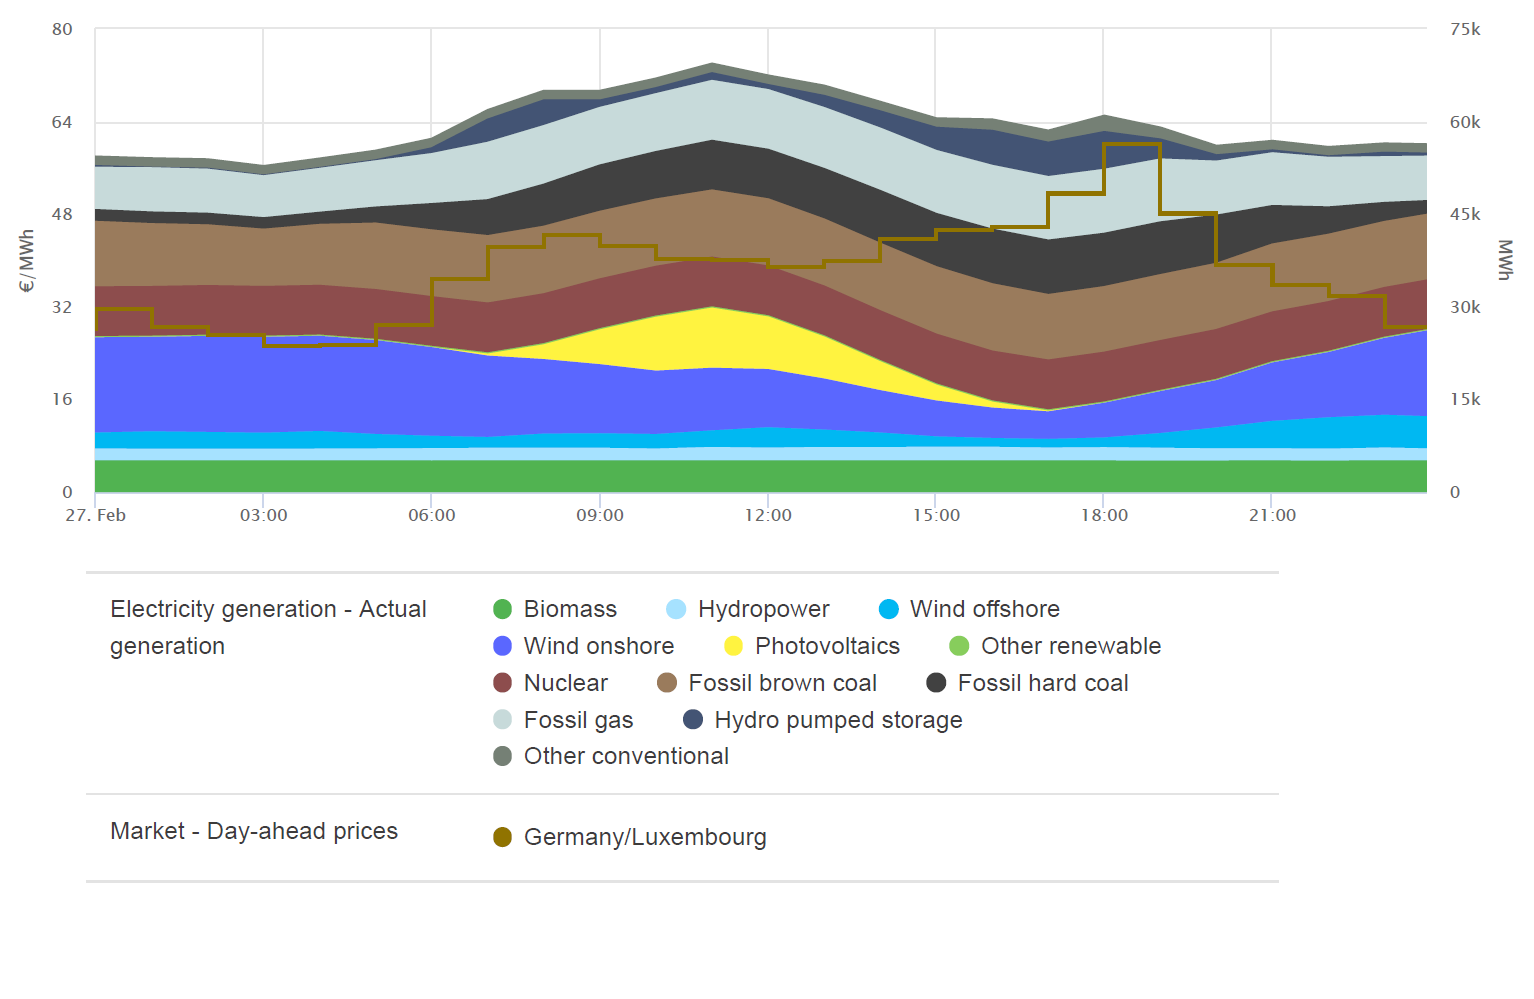
On Sunday 9 February, renewables supplied 87.5% of the electricity consumed that day, which was the highest proportion since the beginning of the year.
On the following weekend, Cyclone Victoria also led to a high wind power output amounting to 1.9 TWh from Friday 14 to Sunday 16 February. Renewables supplied as much as 92.7% of the electricity consumed on that Sunday, which was a new five-year high.
The chart shows renewable electricity generation and electricity consumption during Storm Sabine and Cyclone Victoria.
The wholesale electricity price in Germany
Compared with the previous year, wholesale prices for electricity fell. In February, the hourly products on the EPEX Spot day-ahead market were traded at between minus 32.14 and 59.98 euros per megawatt hour (€/MWh), resulting in an average of €21.92/MWh. This was almost half the average price a year earlier (February 2019: €42.31/MWh) and was the lowest monthly average in five years. The reasons for this include higher renewable output and a decrease of 1.2 TWh in electricity consumption. A large number of negative electricity prices also resulted in a lower average.
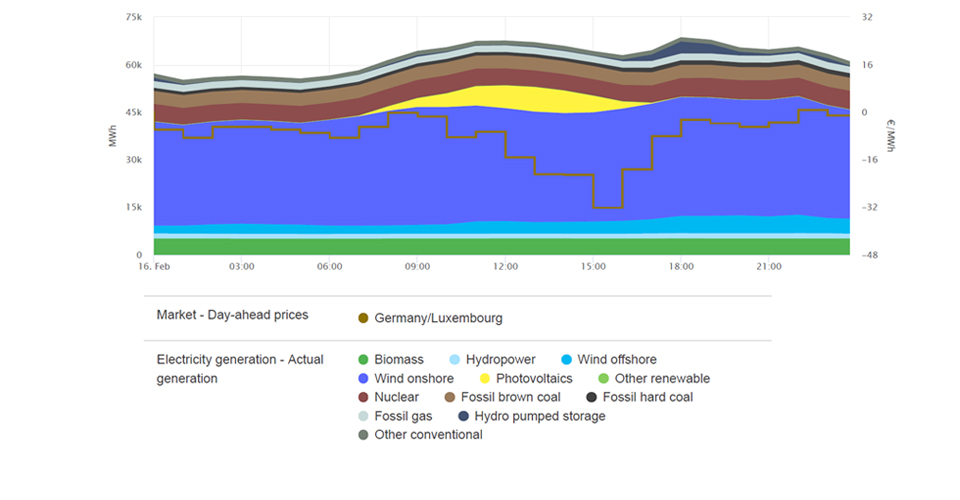
The lowest exchange price was recorded between 3pm and 4pm on Sunday 16 February and was minus 32.14 euros per megawatt hour. During this time electricity consumption was low and renewable energy generation – especially from onshore wind power stations – was high. Onshore wind output totalled around 34.5 GWh.
Compared to the same month a year earlier, the number of hours with negative electricity prices rose from 9 to 84 of the 696 hours of trading, partly due to the high wind power output during the storms and the still-too-low degree of flexibility of conventional power plants. The number of hours with negative prices was the highest monthly number since 2015.
Negative prices were recorded in twelve hours on 9 February alone, including a period of eight consecutive hours. On 10 February, trading at negative prices occurred in six consecutive hours and on 16 February in 23 of the 24 hours of trading, with a period of 22 consecutive hours. The "six-hour rule" took effect on these days, meaning that larger new installations receiving payments under the Renewable Energy Sources Act (EEG) and selling electricity directly did not receive payment in these periods. Under the rule, if the day-ahead price on the electricity exchange is negative for a period of at least six consecutive hours, the installation operators do not receive the market premium as from the first hour in the period with negative prices.
On the day-ahead market, the highest price of the past month of €59.98/MWh was recorded on Thursday 27 February between 6pm and 7pm. In this hour, electricity consumption was high and there was a low level of generation from renewables. The electricity market reacts to this kind of situation by taking power from storage facilities (such as pumped storage stations), reducing the consumption of flexible loads and increasing the use of conventional power stations with higher marginal costs, in particular gas-fired power plants.
Wholesale prices in Germany | ||
| February 2020 | February 2019 |
Average [Euro/MWh] | 21.92 | 42.77 |
Minimum [Euro/MWh] | -32.14 | -4.09 |
Maximum [Euro/MWh] | 59.98 | 69.98 |
Number of hours with negative prices | 84 | 9 |
Data basis: smard.de
Commercial foreign trade
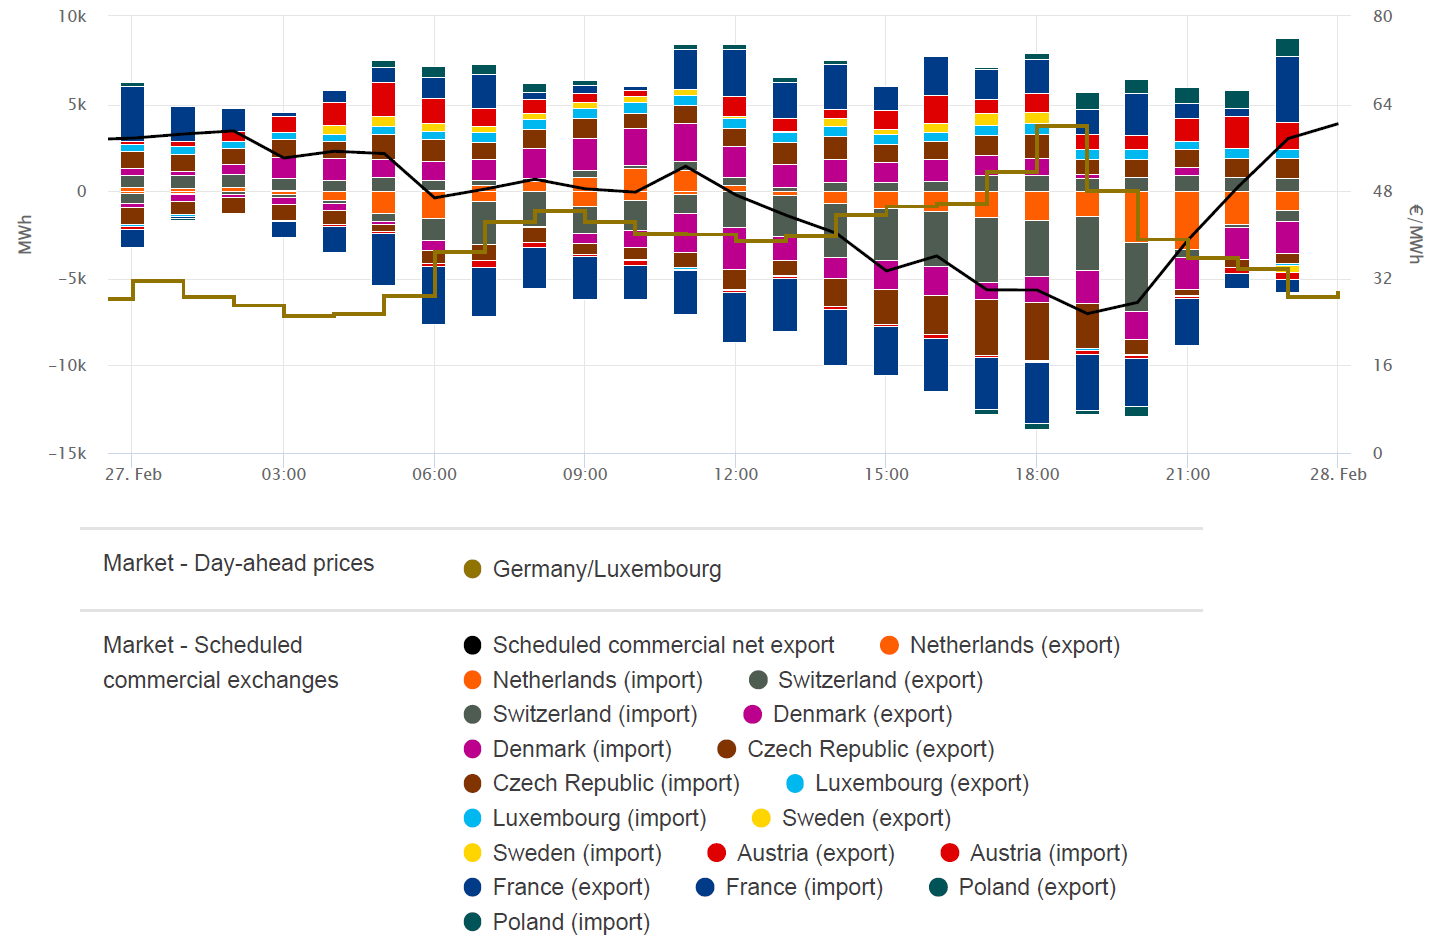
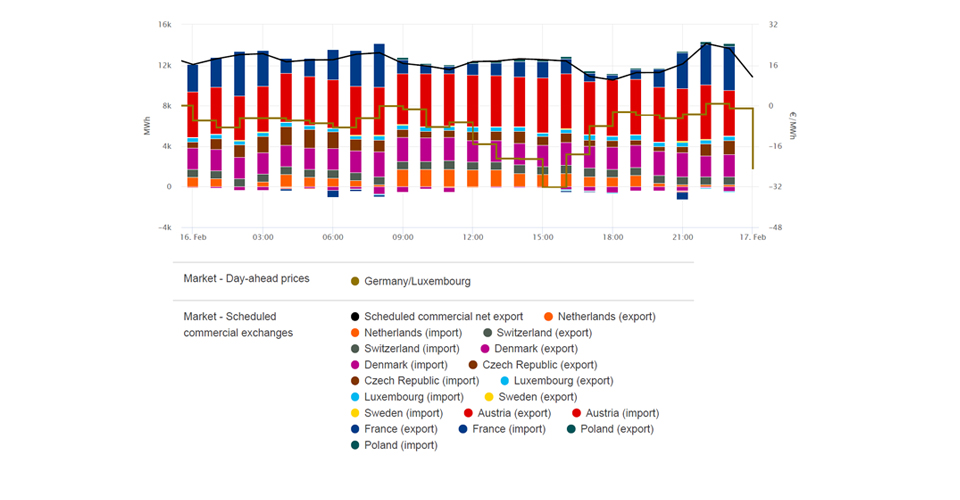
Germany's commercial net exports for February totalled 3.7 TWh, which is 8.4% of all the electricity produced in Germany in the month. In comparison with the previous year, net exports fell by 28%. The main customer for Germany's net exports of electricity (exports less imports) was Austria, which accounted for 2,686 GWh (up 26% compared with the previous year). Czechia followed in second place with 515 GWh (up 1,793%), ahead of Switzerland with 322 GWh (down 52.4%).
One reason for the large increase in exports to Czechia was the number of hours in which electricity from Germany was cheaper. This was the case in 542 of the 696 hours of trading. In February 2019, electricity from Germany was cheaper than in Czechia in only 379 of the 672 hours of trading.
Germany was a net importer from Denmark and Sweden, from which it took a total of 444 GWh and 203.7 GWh, respectively. This represents an increase of 8,074% and 346% respectively compared with the previous year.
The chart gives an overview of Germany's commercial electricity trade. (Gross) exports are shown above the zero line while (gross) imports are shown below the zero line.
Changes in imports and exports are the result of frequent price fluctuations, which reflect the interaction of supply and demand in the respective countries and across borders. These fluctuations are part of normal market activity in the European wholesale electricity trade.
One reason for the large rise in imports from Denmark was the electricity price, which was often lower in both of the Danish zones. The prices in Denmark 1 and Denmark 2 were lower than Germany's prices in 334 and 342 hours respectively out of 696 hours. In February 2019, this was the case in only 149 and 155 hours respectively. Another possible reason is the gradual increase in trading capacity between Germany and western Denmark.
Market data graphs gallery