Hint: This website is not optimized for your browser version.
Evaluation of last year
The electricity market in 2021
07 January 2022 – Electricity consumption in 2021 was up by around 3.7% compared with 2020. Generation from renewable energy sources was 7.7% lower than in 2020 and accounted for 42.8% of electricity consumption. Generation from conventional sources was up by 11%. The average wholesale electricity price was €96.85/MWh and Germany was a net exporter in commercial foreign trade.

Note: When comparing the values, it should be noted that 2020 was a leap year with one more calendar day than 2021.
Electricity consumption once again reaches 2019 level
Electricity consumption (the grid load*) in 2021 totalled around 503.8 TWh, which was 3.7% higher than in 2020 when consumption was down in part due to measures taken to contain the Covid-19 pandemic. However, electricity consumption was at a similar level compared with 2019 (495.5 TWh).
An overview of the energy sources
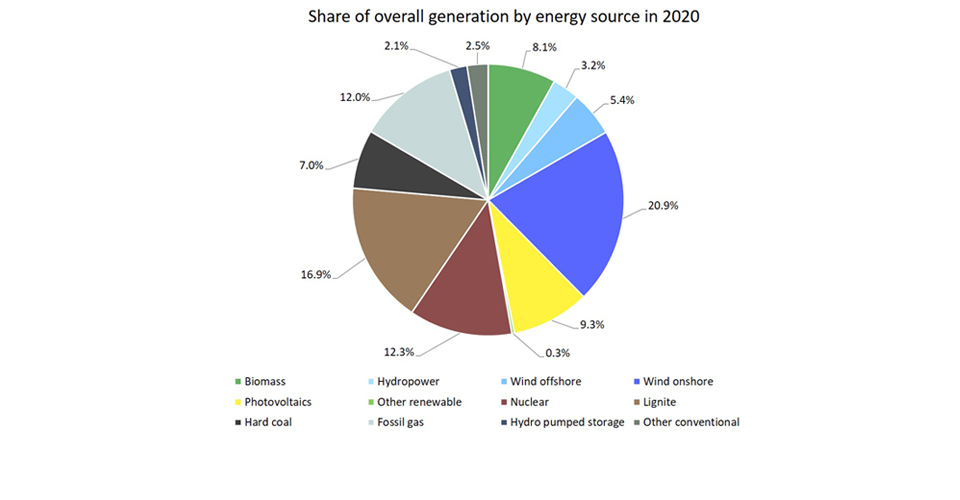
Total energy generation in 2021 was around 505.3 TWh, of which 42.6% (215.4 TWh) was generated by renewables and 57.4% (289.9 TWh) by conventional energy sources.
Compared with the previous year, onshore wind generation was down by around 13.1% at 89.6 TWh and offshore wind generation was down by around 10.8% at 24.0 TWh. Feed-in from wind power plants was high in 2020 due to favourable weather conditions.
Electricity generation from hydropower was 14.5 TWh, down by 7.1% from 2020. There was a slight decrease in generation from biomass, which fell from 40.3 TWh in 2020 to 39.2 TWh in 2021. Generation from other renewable energy sources was down by 4.7% at 1.6 TWh. With an output of 46.6 TWh, photovoltaic installations were the only renewable energy source with higher generation in 2021 (up 1.8%).
According to the national meteorological service (DWD) there were 1,650 hours of sunshine in 2021, which is 7% above the norm, though less sun than in 2020 when there were 1,901 hours of sunshine.
In addition to the weather conditions, changes to the installed generation capacity also play a role. Installed generation capacity for photovoltaic installations increased in 2021 from 48.1 GW to 53.3 GW. Overall generation from renewable energy sources fell by 7.7% compared with the previous year and covered a total of 42.8% of electricity consumption. That is less than in 2020, when 48.0% of electricity consumption was met by renewable generation. Reasons for the decrease in coverage from renewables are the higher level of electricity consumption coupled with less feed-in from renewable energy sources.
Among the conventional energy sources, generation from hard coal had a particularly large increase (48.4%), rising from 34.9 TWh in 2020 to 51.8 TWh in 2021. Also up from last year was generation from lignite (up 17.8%), from nuclear energy (up 7.4%) and from other conventional energy sources (up 6.6%).
By contrast, generation from natural gas-fired power plants was down, falling 11.3% from 59.1 TWh in 2020 to 52.4 TWh in 2021.
The profitability of gas-fired power plants declined because gas prices increased in the course of the year, and that in turn increased the competitiveness of hard coal-fired plants in spite of the higher costs for emission allowances. The cost advantage of gas-fired power plants with regard to emission allowances was superseded by the higher costs of gas. More information about this trend is available in this article.
Generation from pumped storage units was also lower, decreasing by 14.2% from 10.6 TWh in 2020 to 9.1 TWh in 2021. One reason for this was the lower availability of capacity at times due to routine inspections. For example, the "Wehr" pumped storage power station , which has a rated capacity of 910 MW and is the fourth largest power station of its kind in Germany, underwent maintenance from April until mid-November. This was temporarily visible in pumped storage generation figures.
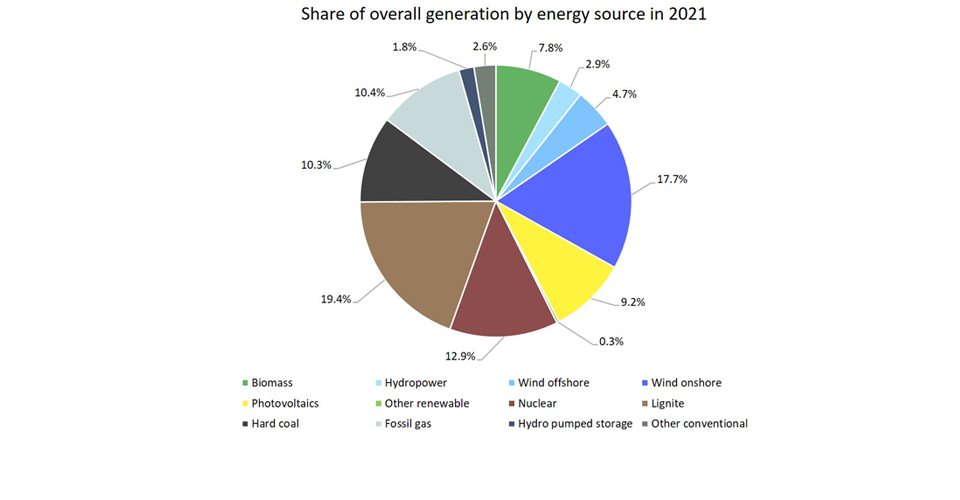
Share of overall generation by energy source
The changes described above affected the individual energy sources' share of total generation. Overall, onshore and offshore wind power stations accounted for the largest share (22.4%) of total generation in spite of less favourable weather conditions, followed by generation from lignite (19.4%) and nuclear energy (12.9%).
Special events in the course of the year
There were several events in the course of the year that particularly affected feed-in from renewables. For example, in March the two storms "Klaus" and "Luis" brought a high level of generation from wind power stations. A partial solar eclipse in June resulted in a temporarily lower level of feed-in from photovoltaic installations, which had been anticipated beforehand in the generation forecasts. In the same month, feed-in from photovoltaic installations reached the highest levels ever recorded for PV systems in the month of June. In August and October, and in other months as well, there were again high levels of feed-in from wind power plants caused by more storms. Despite the storms, wind generation was overall lower last year than in 2020, as the figures above show. A clear difference can be seen, for example, by looking at the month of February: generation from wind energy in February 2021 was 11.2 TWh and in February 2020 it was 20.3 TWh.
At the end of 2021 the nuclear power plants Brokdorf, Grohnde and Gundremmingen (Block C) were taken off the grid. With their closure, only three nuclear power plants remain in operation in Germany, though they are also to be decommissioned by 31 December 2022.
In the course of the coal phase-out, a total of three blocks (each with a rated capacity of 300 MW) of the Neurath, Niederaussem and Weisweiler lignite-fired power plants were closed.
Our "Market data visuals" section has been showing the lower generation levels from both of these energy sources since the turn of the year.
Wholesale electricity prices
The average wholesale electricity price in Germany was higher in 2021 (€96.85/MWh) than in 2020 (€30.47/MWh). During the course of the year the price went from an average of €54.96/MWh in the first half of the year to €138.04/MWh in the second half.
The average wholesale electricity price in Germany's neighbouring countries was €96.13/MWh. Switzerland had the highest average price (€114.94/MWh) and Norway had the lowest average price (€75.10/MWh).
Day-ahead wholesale prices in Germany | |||
2021 | 2020 | 2019 | |
Average [€/MWh] | 96.85 | 30.47 | 37.67 |
Minimum [€/MWh] | -69.00 | -83.94 | -90.01 |
Maximum [€/MWh] | 620.00 | 200.04 | 121.46 |
Number of hours with negative prices | 139 | 298 | 211 |
Number of hours with | 2,667 | 25 | 7 |
The main reason why average German wholesale electricity prices are higher is the trend explained above toward higher generation costs of conventional power stations, in particular the worldwide increase in gas prices. The increase in electricity consumption and rising prices for emission allowances also had an impact. In addition to this there was less feed-in from renewables compared with 2020. Due to lower marginal costs renewables can have a price-reducing effect by replacing the more expensive conventional power stations in the merit order.
A detailed article assessing the higher prices is available here.
In 2020 there were also more negative prices, which reduced the average price accordingly. While negative prices were recorded in 298 hours in 2020, that was the case in only 139 hours last year.
If the day-ahead price on the electricity exchange is negative for a period of at least 6 consecutive hours, the operators of installations selling their electricity directly do not receive the market premium as from the first hour in the period with negative prices. This rule, referred to as the six-hour rule, only took effect in 2021 on eight occasions, with payments being suspended for a total of 80 hours. In 2020 the rule took effect on 17 occasions, with payments being suspended for a total of 192 hours.
Under the amended Renewable Energy Sources Act (EEG) of 2021, the period was reduced to four hours for newly commissioned installations. The four-hour rule took effect on 16 occasions, with payments being suspended for a total of 117 hours.
The highest wholesale electricity price of the month (€620.00/MWh) occurred on Tuesday 21 December between 5pm and 6pm. In this hour, electricity consumption was high at 66.5 GWh and there was a low level of generation from renewables (8.8 GWh).
The lowest price was recorded between 2pm and 3pm on Saturday 22 May and was minus 69.00 euros per megawatt hour. During this hour there was a high level of generation from renewables that covered a total of 97.9% of electricity consumption.
Commercial foreign trade
In commercial foreign trade, Germany exported 17.4 TWh more electricity than it imported, making it an overall net exporter.
An assessment of the trading volumes of imports and exports using the wholesale prices of the Germany/Luxembourg bidding zone places 2021 import costs** at €4,190m and export revenue at €5,332m, resulting in a balance of €1,142m.
Import costs were 273.8% higher than in 2020, and export revenue was up by 267.5%.
There is an interaction between supply and demand across the whole of Europe. Electricity is produced within Europe wherever it is cheapest. When Germany imports electricity, it benefits from the more favourable conditions for generation in other countries, and vice versa. The respective countries' wholesale prices on the day-ahead market are the result of this interplay.
The new interconnector ALEGrO has also enabled trading with Belgium since November 2020, and in April 2021 the NordLink interconnector, which connects Germany and Norway, went into full operation.
Germany was a net exporter of electricity to:
• Austria, with 18.45 TWh (2020: 18.47 TWh)
• France, with 6.48 TWh (2020: 1.61 TWh)
• Luxembourg, with 3.94 TWh (2020: 3.79 TWh)
• Switzerland, with 1.79 TWh (2020: net import of 1.38 TWh)
• the Netherlands, with 1.63 TWh (2020: net import of 1.60 TWh)
• Belgium, with 0.78 TWh (2020: 0.14 TWh)
• Czechia, with 0.22 TWh (2020: 3.77 TWh)
Germany was a net importer of electricity from:
• Poland, with 1.76 TWh (2020: net export of 2.92 TWh)
• Denmark 2, with 1.80 TWh (2020: 0.62 TWh)
• Sweden, with 1.98 TWh (2020: 2.14 TWh)
• Norway, with 3.16 TWh (2020: 0.16 TWh)
• Denmark 1, with 7.21 TWh (2020: 6.32 TWh)
_______________________________________________________________________________________________________________
*The grid load share of electricity that was generated from renewables is calculated differently than the federal government’s target definitions for the expansion of renewable energy under the EEG, where the basis for calculation is gross electricity consumption. The grid load does not include power stations’ own consumption or industrial networks, so the calculation basis applied here – compared with the share of gross electricity consumption – typically results in a higher proportion of generation from renewables. The grid load is calculated by taking the net electricity generation, subtracting transmission capacity exports, adding transmission capacity imports and subtracting the pumping work at pumped storage power stations.
**The commercial foreign trade data used in this article that were determined by the results of electricity trading show the planned imports and exports. The imports and exports result from the sum of all volumes of electricity used or nominated in electricity trading from/to adjacent countries in the interconnected system (referred to as exchange schedules). The net export results from the balance of imports and exports. To calculate the costs and revenue, the imports and exports were offset against the hourly day-ahead prices on SMARD.
The figures presented in the chart and in the text may be updated at a later date. Further information about possible updates and data definitions is available (in German) in the user guide.